
Tasks Pane - Visualize
To access this Tasks Pane view:
-
Display the Tasks Pane and select the Visualize option.
The Visualize panel is used to generate and display data associated with the optimization workflow.
Links to each of the key 3D data inputs and outputs are listed here. Links are disabled if no data of that type yet exists in your project.
Viewable data is split into two categories; models and surfaces. This data may or may not already be loaded into a 3D window. If already loaded, it is regenerated and reloaded.
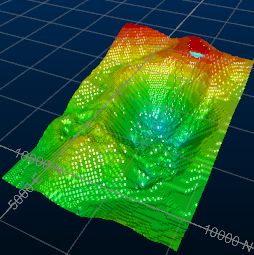
An animation frame of a strategic LOM playback
Loaded 3D data will appear in the primary 3D display window along with a dedicated animation toolbar, and available as one or more object overlays in the Project Data control bar.
See Visualizing Surfaces and The Surface Animation Toolbar.
Model Visualization Options
The following model visualization options are available on the Visualize panel:
- Imported – View the model as originally imported (and used as a basis for creating the economic model). See Data Import Essentials.
- Economic – If an economic model has been generated, click to view it in the primary 3D window. See Economic Model Essentials.
- Optimized Pit – If a nested pit shell model has been generated, click to view it. See Pit Optimization Essentials.
- Optimized Pushbacks – If a pushback model has been generated, click to view it. See What is a Pushback?
- Optimized Schedule – If an OES has been generated, view the OES model here. See Scheduling Pushbacks.
- Optimized MAO/MFO – If a MAO or MFO model has been generated, click to view it. See What is Mine Flow Optimizer? and What is Material Allocation Optimizer?.
- Slope Regions – If Geological Risk Assessment has been performed, view the GRA slope region model here. See Geological Risk Assessment Essentials (GRA).
Surface Visualization Options
Click an active link in the panel to display the following:
- Topography – View the default topography associated with the current plan.
- Ultimate Pit – View the current ultimate pit surface data.
- Pit Shells – Displays the Show Surface Options screen, used to control the surfaces you wish to include in your loaded surface object.
- Pushbacks – View generated pushback surfaces.
- Scheduler Period Pits – View per-period surfaces.
- FMS Period Pits – Display per-period surfaces showing the results of Flexible Material Scheduler.
- MFO Period Pits – Display per-period surfaces showing the results of MFO or MAO.
- Risk Rated Pits – Display per-period surfaces showing the results of Geological Risk Assessment.
- Other Surfaces – Displays the Choose Surfaces to Display screen.
Related topics and activities