|
|
Viewing Linked Histogram Data
 2
2
3D data objects which have been loaded, displayed in the Design
and/or
|
|
This data selection and viewing across windows cab be used to:
|

Viewing Selected Data in a Histogram Chart Sheet
The following steps require that a 3D object has already been loaded and also used to generate a histogram chart:
-
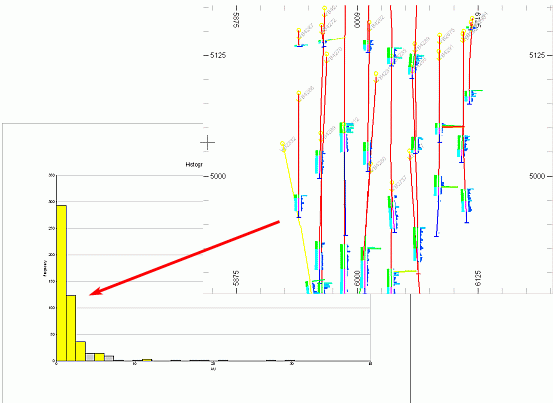
In the 3D window, select the required data e.g. drillhole samples from a particular horizon in one or more drillholes.
-
Check that the selected items are highlighted yellow.
-
In the Plots window, select the corresponding Histogram Chart sheet.
-
Look for the highlighted histogram bars.
Viewing a Selected Histogram Chart Bar
The following steps require that a 3D object has already been loaded and also used to generate a histogram chart:
-
In the Plots window, Histogram Chart sheet, double-click the chart to open the Histogram dialog.
-
In the Histogram dialog, select the required histogram bars.
-
Check that the selected items are highlighted yellow.
-
In the 3Dwindow, look for the highlighted data items.
|
|
In order for data selection to be visible in another window, the Enable automatic redraw option needs to be set (Home ribbon, Project | Settings dialog, Design tab). |
|
|
Related Topics |
|
|
Histograms
- Data Selection |


