KNA: Optimize Block Sizes
To access this screen:
-
Advanced Estimation wizard >> KNA >> Optimize>> Optimize Block Sizes.
This panel is used to help determine the optimum block size. A range of statistical parameters are calculated and a Block Size chart is displayed to show the relationship between each parameter and one of the block dimensions.
This panel is only visible if Supervisor data is not being imported. You decide this using the Scenario Setup screen.
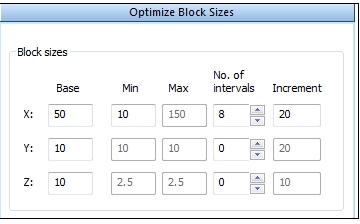
Define the size of a model cell in each of the X, Y and Z directions by entering the minimum size, the number of intervals and the increment between successive values for each of the three directions as described in the Optimize section.
The calculation of statistics also needs the number of discretization points in each direction to be defined; these are defined by the Base values selected in the Optimize Discretization sub-panel. In addition a set of search volume parameters, defined by the Base values in the Optimize Search Volume sub-panel, must exist.
Tip: check the Base values in both Optimize
Discretization and Optimize
Search Volume sub-panels before running a test.
Example
In the following example, only the X block size changes while the block size in Y and Z is fixed at 10m.
Inputs- Variogram Model
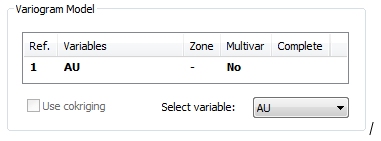
The variogram model has been selected by double clicking the required model in the Variogram Model area of the Optimize panel:
This example is based on a single structure spherical anisotropic model with the following parameters:
-
Nugget: 0.35
-
Sill: 3.87
-
Rotation: 22.5 degrees around Z|
-
Ranges: X - 82.8, Y - 93.2, Z - 25.6
Inputs- Discretization
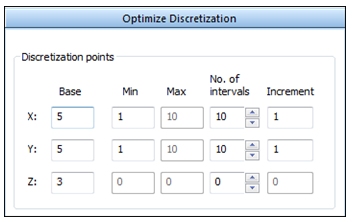
These parameters are defined by their Base values in the Optimize Discretization sub-panel:
- Number of discretization points:
- X: 5
- Y: 5
- Z: 3
The Optimize Discretization panel looks like this:
Inputs- Search Parameters
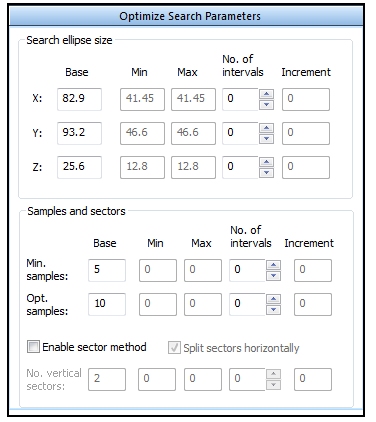
These parameters are defined by their Base values in the Optimize Search Parameters sub-panel:
- The lengths
of the search volume axes:
- X: 82.9
- Y: 93.2
Z: 25.6
Note: the initial default values are set equal to the maximum variogram ranges in each direction.
- Minimum number of samples: 5
- Optimum number of samples: 10
- Segment method: not applied
In the image below only the Base values are used for optimizing the block size.
The following parameters are defined using the Optimize Block Sizes sub-panel:
Note: Increment values are rounded up to the nearest integer.
Inputs - Combinations
The Test reduced combinations option is checked:

This ensures a total of 8 KNA runs. The combinations of values to be tested are:

Run Tests starts the KNA runs.
Outputs – Slope of Regression
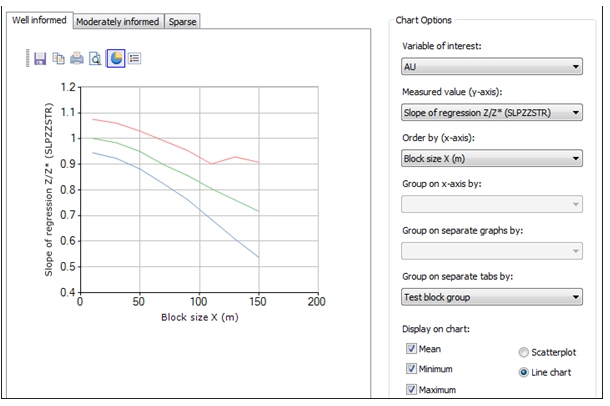
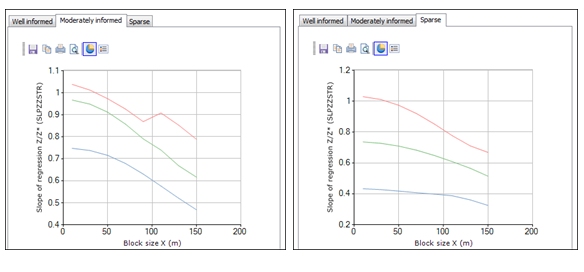
The chart display option Group on separate tabs by has been selected as Test block group so the results for each location are shown on different tabs.
The results for the Well informed location are shown below. The mean slope of regression(green line) has a value of 1 for a block size in X of 10m but reduces as the block size increases:
The corresponding charts for the Moderately informed and Sparse locations are shown below. The mean regression slope for Moderately informed is similar to Well informed, but the mean slope for Sparse is considerably lower reflecting the lower sampling density:
Statistical Parameters
The table below shows the statistical parameters that are reported for each run. These parameters appear in the Measured value (y-axis) list:
Related topics and activities

