Project Data: Plots
To access this menu:
- The Plots folder is a sub-folder of your Project Data control bar. It can be expanded to reveal further categories of data.
The Plots window, with its comprehensive suite of data source drivers, can use data from a huge variety of sources and bring it all together into a single model showing all the characteristics and properties you choose, and in whatever format you select to maximize the presentational impact.
The Plots folder of the Project Data control bar allows you to access plot-specific information about your loaded data objects, and to configure report-ready plots for presenting.
The Plots menu is comprised of the following items:
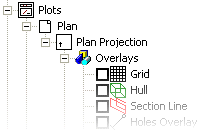
Each available folder (Plan, 3D or section) contains subfolders showing the current Projection (or set of projections if a set exists). Expanding the Projection folder shows a list of available Overlays, for example:

The context menus available for each section differ, and are described below:
Plots Folder Menu (Sheets control bar)
Note: This facility is not available to the Project Data bar.
Right-clicking the Plots folder icon in the Sheets control bar to reveal these options:
-
New Plot Sheet – Add a new sheet, with further options for a Vertical Section, Plan or Custom Sheet.
-
Paste – Paste a copy of clipboard data into the Plots folder. Only available if clipboard data exists.
Sheet, Projection and Overlays Menu
Right-clicking a Sheet, Projection or Overlay shows the following context-menu (note that not all options will be available if data is not currently copied to the clipboard).
-
Select/Deselect All – Select all items of the current sheet, overlay or projection.
-
Data Object Manager – Display the Data Object Manager to modify loaded data objects.
-
[Data Type] Properties – Display the properties screen for the selected item.
-
Insert – Display the Plot Item Library insert a new plot item.
Note: When inserting plot items with this command, any plot items that relates to a particular projection (for example, a title bar showing the description of a projection) should not be added at this level, instead, they should be added by right-clicking the relevant Projection folder and selecting Insert.... This ensures dynamic text is updated correctly.
-
Copy [Data Type] – Copy the currently selected item to the clipboard.
-
Insert copy of... – Insert a duplicate of the currently copied item. Only available if you right click the containing folder of the originally copied item.
-
Paste Plot item/Format/Special – Methods for pasting data.
Note: You can only paste clipboard data of an appropriate type into the selected folder.
-
Quick Legend – Display the Quick Legend screen for simple legend creation and editing.
-
Wizard – Display an Object Summary screen to view and (optionally) amend properties related to the selected item.
-
Reset – Reset the selected overlay to default settings.
-
Rename – Rename the selected overlay.
Note: Overlay names (the name of the representation of an object) track object names (the name of the data object in memory) by default unless you provide a custom overlay name. After this, the overlay retains the custom name, even if the object name changes.
-
Delete... – Delete the currently selected item. This does not delete file data on disk.
If a sheet is selected, the following option becomes available:
-
Lock/Unlock Overlay updates – If a sheet is 'locked' it will not be altered when new data is loaded into memory. If locked, the 'unlock' option displays, enforcing an update of all associated projections when data is imported. Note that any unload operation will override a locked sheet; it is not possible to show data in a plot sheet that does not exist in memory.
If all overlays are locked for the entire sheet - that sheet is shown with a black 'lock' symbol in the Sheets control bar. Conversely, if all sheets are unlocked, no lock icon is shown. If a proportion of the overlays displayed within a given sheet (but not all) are locked, a lock icon is still displayed, but in grey.
Consider the following example where a sheet contains two projections. If the overlays for both projections (and thus, all overlays for the sheet) are locked, the following icon displays:

If only one of the two projections is locked, the icon will appear as a light grey version:

If no overlays are locked for any displayed projection, a 'normal' icon is shown:

Related topics and activities

