
Project Data Control Bar
To access this control bar:
- The Project Data control bar is displayed by default, but can be hidden. To (re)display this control bar, select it in the System ribbon's Show menu.
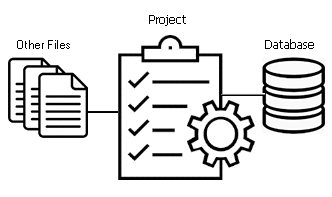
The Project Data control bar displays all data associated with your Studio Survey project. This includes both Local Files and data held within the active Survey Database.
Data is categorized according to its type. Data overlays (visual representations of an object) are displayed in a view-specific sub-folder (3D, external 3D windows and Plots).
Each area is supported by context-sensitive menus. These menus can be used to work directly on files (files that are referenced by your project) and objects (instances of file data that is loaded into memory) and their corresponding overlays (visual representations of objects; one object can have multiple overlays). The menus that are presented will depend on the categorization of data that is in focus (file, object, overlay) as well as the data type of objects/overlays that have been loaded (wireframes, points, strings etc.)
The Project Data bar displays a toolbar at the top to access useful file-related functions:
|
|
Description |
|
|
Collapse all folders in the tree, hiding their contents. |
|
|
Refresh the project files list. This will also update the icons representing each file type. See Project Icon Reference. |
|
|
Add new files to the project. |
|
|
Add existing files to the project. |
|
|
Import external data files, saving them to Datamine format and adding them to the project. |
The basic layout of the Project Data Control bar is as follows:
-
Survey Database
Files that are used as inputs, generated volumes, templates and other data used within Studio Survey's reporting tools, and have been added to the Studio Survey database using the Add to Database tool.
Although a standard database structure is used (and expected) by Studio Survey, you can easily set up new (or edit existing) pits, areas, ROMs and surveyors using the Database Settings screen.
Also see:
-
Other Files
Files that are referenced by your Studio Survey project, but are not used directly in EOM reporting i.e. they are not part of your Studio Survey database.
Typically, local files are used to support your reporting workflow, and can be anywhere directly accessible to your PC (local, LAN, WAN, synchronized Cloud folder).
-
Loaded Objects
This folder contains a list of all loaded data objects, including 3D objects and non-visual tables. You can use this to review your objects and access context-sensitive menu functions such as reloading, refreshing, unloading and attributing objects. See Loaded Objects Context Menus.
-
3D
Object overlays currently displayed in a nominated 3D window, categorized by their survey data type. See Project Data Control Bar (3D Folder)
-
Plots
Plots, sheets, projections and overlays currently displayed in the Plots window. See The Plots Window and Project Data: Plots Folder.
-
(Other 3D windows)
Linked and Independent 3D windows are each supported by their own folder structure, which mimics that shown for the system 3D window (see above). See External 3D Views.
Control Bar Setup
The Project Data control bar is displayed by default as an automatically-expanding panel on the left of the screen. Like other control bars, it can be docked, floated, hidden. You can find out more about how to set this up here.
Related topics and activities