
Plan Compliance Report
To access this screen:
-
Activate the Survey Reports ribbon and select Open Pit >> Plan Compliance.
-
Run the command "compliance-to-plan".
-
Use the quick keys 'cpl'
The main purpose of the Plan Compliance report is to assess the correlation of ground data for a given period versus the predicted end-of-period surface. This is with respect to:
- Material mined and planned.
- Overbreak (material mined but not planned).
- Underbreak (material planned but not mined).
However, it may be the case that you want to avoid reporting volumes mined outside the design as being ahead of schedule. In this case, you can define a Design Pit Surface to act as a reporting constraint. If a design surface is specified, you can report against a further criterion:
-
Material mined but not planned but not designed. This is the volume that lies below the design surface.
As with other Studio Survey reports, the design and as-mined surface are selected according to date. This data will have been committed to the current database using the Add to Database tool.
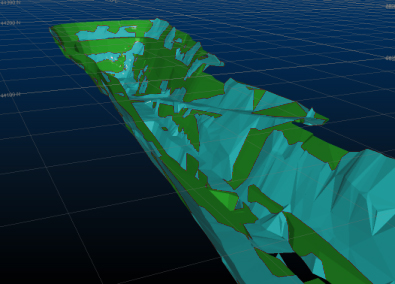
An example of surveyed ground data against a planned pit shell
This facility is currently only available for open pit survey scenarios.
Note: This tool supports batch processing: use Add to Batch to schedule processing at a later date, using the Run Batch task.
In the context of the Plan Compliance command, an End-of Period Surface represents the predicted surface for the selected reporting period. This is similar to the Design Compliance report, although this compares the as-mined surface with the longer-term design.
In summary, it is used to compare the actual end-of-period surface to the planned and scheduled surface produced by planning engineers (e.g. using Studio OP). This is used to highlight areas where the plan was not adhered to and the extent to which the longer term strategic plan is being honoured.
Any surveyed pit surface can be selected (by its survey date). The design surface must have been added to the current database as the Designed Pit Surfaces type for it to be selectable.
A boundary string can be specified if required. This will restrict the surface comparison and cut/fill volume calculation to the surface data falling within the perimeter. This boundary will be applied to both the End of Period Pit Surface and Surveyed Pit Surface.
Plan Compliance Example
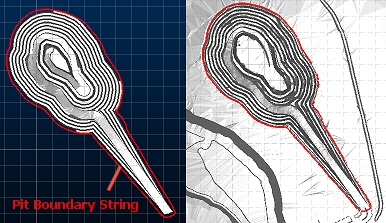
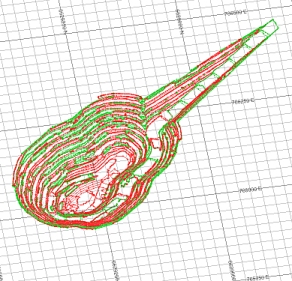
For example, in the image below, the End of Period Pit Surface is shown on the left and the ground data for the same reporting period is shown on the right. A Design Pit Surface is not specified in this example.
The boundary string is shown in both views in red:
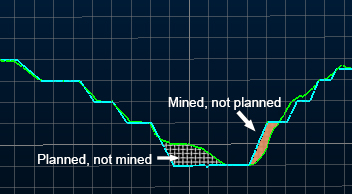
Whilst superficially similar, the two surfaces differ (within the boundary) in some areas. For example, a magnified view of an east/west profile shows examples of both planned/not mined and mined/not planned extraction:
Note: If a Design Pit Surface were specified in the example, above, the output report is generated using a dedicated "...limited by design surface' template. Templates are specified using the Database Settings screen (Compliance to Plan section).
Report Output File Naming Convention
Output files from Studio Survey's reporting processes follow the same file naming convention. This is adopted to make files more easily recognizable outside of Studio Survey, and to make searching for them easier.
The following conventions are used
for reports:
Open pit
scenarios:
Report_<pit>_<area>_<rom>_<date>.xlsx
For example:
Report_Pit_1_Area_1_ROM_1_2020-03-23.xlsx
The following conventions are used for output data:
Open pit scenarios:
<data type>_<pit>_<area>_<rom>_<date>.dm
For example:
NaturalSurface_Pit_1_Area_1_2020-03-24_tr.dm
The Compliance to Plan Published Report
The Compliance to Plan default published report contains undermine and overmine tonnages for the reporting period, plus the net calculation, according to the bench definition for the reporting scope.
For the simplest report (where two surveyed surfaces and an end-of-period surface are specified, no designed pit surface), this information is typically subdivided into per-elevation/bench data, which
can be useful to see where net volume discrepancies have occurred,
e.g.: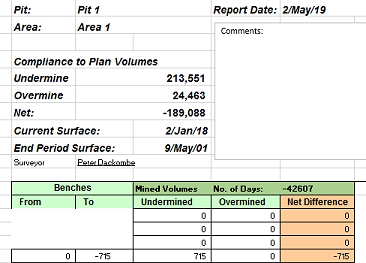
The Compliance to Plan default published report contains undermine and overmine tonnages for the reporting period, plus the net calculation. This information is subdivided into per-elevation/bench data, which can be useful to see where net volume discrepancies have occurred.
The other report scenarios are:
-
A report comparing a surveyed surface and an end-of-period surface, only reporting values above a nominated design surface. This is the "2 surfaces limited by design surface report".
-
A report comparing two surveyed surfaces and an end-of-period surface, with no comparison to a design surface. This is the "3 surfaces report".
-
A report comparing two surveyed surfaces and an end-of-period surface, only reporting values above a nominated design surface. This is the "3 surfaces limited by design surface report".
You can find out more about these report types in the "Plan Compliance Report" section further below.
Note: Report templates for all four Plan Compliance scenarios are defined using the Database Settings screen. See Configure the Plan Compliance Report.
Plan Compliance Report Output
Plan Compliance reporting generates the following items:
- A spreadsheet containing a Plan Compliance worksheet. This worksheet is explained in more detail here.
- In the simplest output type, a wireframe file pair representing the volume differences between
the expected/designed surface and the surveyed data, e.g:
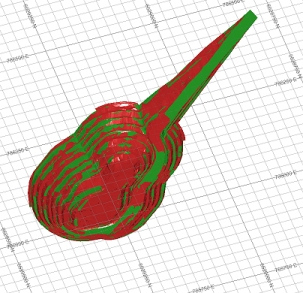
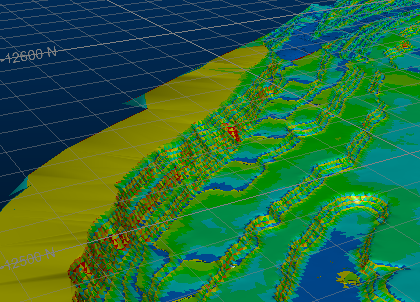
The default colouring represents areas that have been planned-not-mined (red) and mined-not-planned (green).Compliance wireframe data includes a True_Thickness attribute that contains the true thickness of the solid at each location. This could be useful, for example, to highlight areas of concern, ignoring acceptable thickness tolerances, For example, if a 0.5m variation in toe position is acceptable, you may only be concerned with values above this threshold. For example, the image below shows output compliance solids coloured using a blue-red (thin-thick) legend, highlighting potential areas of concern in red:
-
If a third surface, the optional Survey Pit Surface (previous) is specified, additional data will be output representing planned-and-mined volumes, for example, in the image below the Surveyed Pit Surface is (current) the mined (brown) and the End Of Period Pit Surface is the planned (blue). The optional previous pit surface represents the Initial surface for the calculation (red):
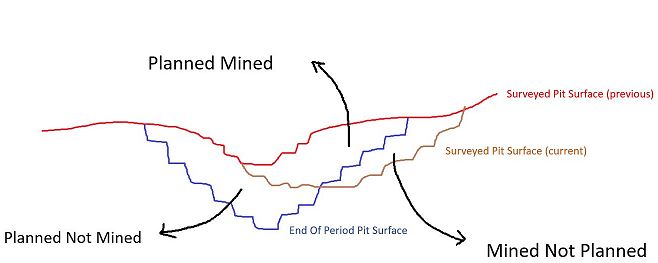
In this situation, the output wireframe and report will represent 3 separate volumes:
- Planned-and-mined
- Planned-not-mined (underbreak)
- Mine-not-planned (overbreak)
-
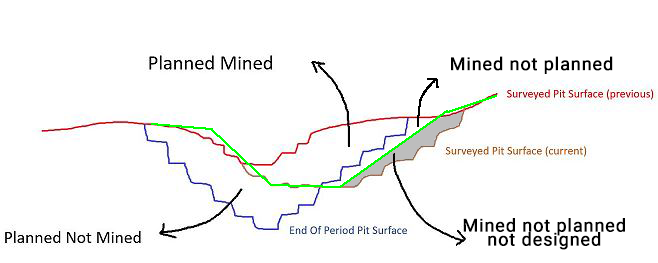
If a Design Pit Surface is specified, and your reporting template is configured to report it (see Configure the Plan Compliance Report), you can report 'mined-not-planned-not-designed' volumes separately (and most importantly, not include these volumes in other categories):
- Regardless of your report type, a strings object containing outline strings for each overmine
or undermine volume, e.g.:
- A Datamine table containing volume calculations for each overmine/undermine volume, per bench. This table is used during publishing to create or update the output results spreadsheet.
- A copy of any boundary strings used to constrain output volumes.
Using the Reporting Date Calendar
When you select a date for reporting, the calendar tool can be used to see previous report date(s). These are highlighted in red, e.g.:
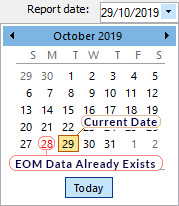
You can regenerate EOM data for any date, including dates for which EOM
output already exists but, in this scenario, you will need to confirm
if you wish to overwrite existing data.
Previewing and Loading Report Data
EOM reporting panels offer functions to preview both your report input surfaces/strings and your output volumes and reports/tables.

- Preview data: available for all report inputs represented by 3D data.
- Load data: available for all report inputs represented by 3D data, including output data.
If results data is previewed, up to three separate displays will be created:
- A PDF or .emf report: this is generated based on the current Plot Template that is associated with your project. Only displayed if it is possible to generate an output report in this format. Not seeing a PDF or .emf report? Check to see if your report has an associated plot template, using the Database Settings screen.
- Wireframe Volume: this represents the cut & fill solids created by your reporting task. This is shown in Datamine's Table Previewer application. Only displayed if it is possible to construct a 3-dimensional volume from the input data of your report.
- A Report Table: this table, in Datamine format, contains the volume assessment of your cut & fill volumes for the selected report. If it is not possible to construct a 3-dimensional volume, a table (nor any other output) will be displayed.
Compliance to Plan Report Activity
To configure a Compliance to Plan EOM report:
-
Select the Current Pit that relates to the report you plan to create. The pit associated with the current project is set using the Database Settings screen. You can either pick an existing pit or access the settings dialog to modify the pits of the current database.
-
Choose the Current Area to which the monthly report relates. This can also be changed using the Database Settings screen, accessible via the browse button. You can either pick an existing area or access the settings dialog to modify the areas of the current database.
-
Select the Surveyor for the current report. Surveyor names are configured using the Survey Database Settings task. The Surveyor is displayed in the output end-of-month results, and will appear in the generated spreadsheet report once published.
-
Choose the Report Date. This is the date to be associated with filing the report. By default, this will be the current date. This information is stored in the output wireframe triangles file generated by the reporting process (according to cut and fill calculations), and will be shown in the accompanying published spreadsheet.
Note: You can generate multiple reports on the same day if you need to; each report will be labelled according to the time it was generated.
-
Choose a Surveyed Pit Surface (current). Select the ground data for a given reporting period. You can choose from any surface that was added to the current database with the data type Surveyed Pit Surfaces.
-
Optionally, choose a Surveyed Pit Surface (previous). This surface represents the ground data for the previous period. If a previous surface is selected, the output report will contain planned-and-mined results in addition to overbreak and underbreak.
-
Pick an End of Period Pit Surface. This surface is the predicted end-of-period surface, as generated by Studio OP, for example. Commonly this is used to determine the overall compliance of the extraction operations over the specified time period with the expected result, and will be used to drive downstream processes such as penalty calculations, regeneration of schedule information and so on.
-
Optionally, pick an Design Pit Surfaceif you want to avoid reporting volumes mined outside the design as being ahead of schedule. If specified, this surface acts as a reporting constraint. This allows you to calculate and present a "mined-not-planned-not-designed" volume category.
-
Pick the Benches to include in your report. By default, all benches from the highest to lowest will be used for reporting, but you can constrain the reporting range using the From and To boxes. Benches are listed as defined in Database Settings.
-
Optionally, pick a Pit Excavation Boundary. A boundary be used to constrain the context of volume generation/calculation. Any data item within the database (for the given pit/area) of the type ExcavationPit Boundaries can be selected, and will be applied to both the Surveyed Pit Surface and the End of Period Pit Surface. If multiple string entities exist within the file, you can select an attribute-value pair to denote which entity to be used for your Compliance to Plan report.
-
Choose your cut and fill Calculation Options. These determine how data fragments and noise are detected when calculating a cut and fill volume.
-
Remove solids with volume below: by default, all cut and fill volumes that represent the difference between the specified surfaces (optionally constrained by a boundary) will contribute to the output EOM report. You can change this number to remove trivial fragments below a specified volume, with higher values leading to potentially greater volume removal where multiple small volumes are output.
-
Trim solids with thickness below: reduce the number of thin data fragments result from near-coincident surfaces by increasing this value. Higher values will tend to increase the amount of data removed from the output cut and fill solids and resulting report.
-
Decimate input surfaces to limit triangles to: ground data can be represented by very dense wireframe data, and this can lead to increased cut and fill calculation times. Enabled by default, input surfaces will be pre-decimated to reduce their data density and commit less dense/simplified data into the EOM volume calculation routine. This can increase the performance of the EOM reporting tool at the sacrifice of input surface detail.
-
-
If you wish, you can Use a fixed plot scale. If checked, all plotted items will honour the scale set. This can be useful if projections on your report relate to the same data in different views, for example.
-
To attempt to avoid trivial volume creation where surface triangles don't match exactly in unmined areas, make sure Match surface triangulation where possible is checked.
-
If unchecked, triangulation of surface data in unmined areas may produce 'noisy' data fragments where wireframe triangulation is not applied identically.
-
-
You can also set up a batch run of reports if required:
-
Review the results of the calculations.
Add to Batch: add the current report definition to a queue of batched tasks that can be run later using the Run Batch task. Data will not be processed until the batch is processed, meaning changes made to data between report specification and execution will be included.
Related topics and activities