
Create, Edit or Delete a Pivot Table
The following activity shows example configuration to generate a per-stope volume results, broken down by design data type.
Activity Steps
-
Open the Activity Pivot Tables screen. You can do this via the Report panel or the Planning ribbon (Report >> Pivot Tables).
-
To create a new pivot table:
-
Select + to create a new pivot table.
-
If required, change the default pivot table name by typing a new one.
-
-
To create a copy of an existing table:
-
Select the table to be copied to highlight it in yellow.
-
Select Copy.
-
-
To delete a pivot table:
-
Select the table to delete.
-
Click Delete. This cannot be undone.
-
-
To configure pivot table rows:
-
Drag your primary attribute (e.g. DES_TYPE) from the Fields list onto the Drop Row Fields Here landing cell.
All available design types display as table rows.
-
Order table rows using the up and down column header button.
-
-
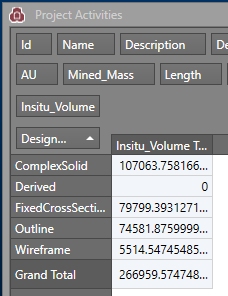
To configure data items:
-
Drag your attribute, typically denoting a numeric quantity (for example, Insitu_Volume), from the Fields list to Drop Data Items Here landing cell.
Tabular results of your data item quantity display, broken down by row item values.
-
Review the tabular results, for example:
-
-
To introduce another attribute (e.g. Stope Number) to create a 3D pivot:
-
Drag and drop a field (typically containing categorical values) from the Fields list to the Drop Column Fields Here drop area.
A new table column displays for each unique value in the new attribute, for example: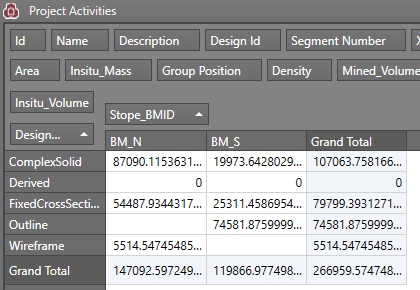
A grand total is shown for each new column value (e.g. stope number) at the bottom of each column. A total is also listed on the right of the table for each row value (e.g. design type).Note: if the selected column field is a weighted value (as determined by its configuration on the Properties screen), the corresponding pivot table header cell will include an "x̄" suffix. For example, if an AU property is weighted on Mined_Mass, it will appear in the table as "AU x̄" and all values will be weighted accordingly.
-
-
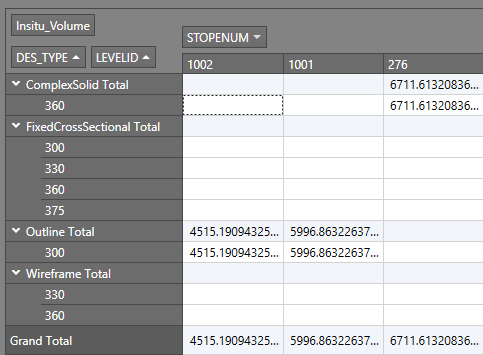
Continue to add further pivots by dragging data from the Fields list:
-
Add more quantitative attribute values by dragging additional fields to the data items area.
-
Add subcategories to your table rows by dragging additional fields to the table row header area.
-
Add further subset column categories by dragging additional fields to the table column data header area.
For example, in the table below, Insitu_Volume (data item) is reported by DES_TYPE and LEVELID (row items) for each unique STOPENUM (column item):
-
-
Pivot precedence determines the hierarchy used to report results. For example, if DES_TYPE volumes are required, broken down into LEVELID values, DES_TYPE has precedence. Conversely, to report LEVELID volumes according to each DES_TYPE, LEVELID has precedence.
To change the order of pivot precedence:Note: Changing the order of the pivot attributes can have a significant impact on the table layout.
- In either the data items, row items or column items area, drag an attribute (to assume precedence) to the left of other items in the same group, or;
- Right-click the attribute button in the data, row or column header area and select an option from the Order menu. Only relevant items display.
-
To remove pivot report items:
-
Drag the attribute field button from the table back to the Fields list, or;
-
Right-click the attribute button in the data, row or column area and select Hide this Field.
The tabular report updates to show reduced pivot items.
-
-
To change the sort order of the table:
-
Sort a table column attribute by a table row value by right-clicking the row item and selecting an appropriate Sort [Column Name] by this row item.
-
Sort a table row by a table column item by right-clicking the column item and selecting Sort [Row Name] by this column item.
-
-
To filter the results shown in the table using a complex filter:
-
Select the Filter Editor option at the bottom of the table:
The Filter Editor displays.
-
Click "+" to create a dummy filter:
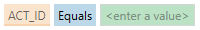
-
Click the orange item to pick an attribute from your schedule table.
-
Click the blue item to select an operator.
-
Click the green item to enter a value condition, or use the drop-down error to select a valid value.
-
If multiple expressions are required, choose how they are applied using the dark blue button (default = "And").
-
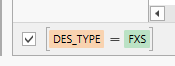
Click OK to apply the filter expression(s) and return to the data table.
The table reappears with an additional filter indicator at the bottom, for example:
-
Toggle the defined filter on or off using the associated check box.
-
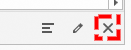
If the filter is no longer needed, delete it using the "X" in the tooltray:
-
-
To filter the results shown in the table using data header filtering:
-
Hover over the Data Headers link.
Column headers display in a popup window, for example:

-
Hover over the field containing the values you wish to filter, and select the filter icon.
The field filter popup displays, for example: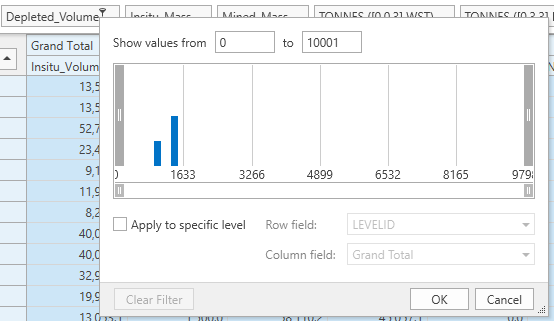
-
To restrict table rows to display only those within a particular range (for the target field), enter appropriate values in the Show values from and to fields.
-
To apply a filter only to values representing a particular level:
-
Check Apply to specific level. If unchecked, the filter will be applied based on all values in the selected column.
-
Select the table row containing the target level value (Row field).
-
Select the table column containing the target level value (Column field).
-
-
Click OK to apply the data header filter to the table.
-
-
To change the formatting of data, row or column attribute values:
-
Right click the attribute in either the data, row or column header area.
-
Expand the Formatting menu.
-
Select General to reset the value display to its default.
-
Select Number to increase or decrease the number of decimal places used to represent numbers.
Note: Decimal place settings have no effect on alphanumeric values.
- Hide or remove the numeric thousands separator, if appropriate.
-
-
To reload the data object associated with data, row or column values, right-click the attribute button and select Reload Data.
-
If required, format your tabular report by defining rules.
-
If required, export pivot data in comma-delimited format (for example, to Excel).
The table updates to show adjust pivot precedence.
Related Information and Activities