Selecting the Direction of Maximum Continuity on Variogram Fans
After inserting at least one variogram fan, you need to set the direction of maximum continuity to calculate further variogram fans or variograms. See Insert Variogram Fans for steps on inserting and adjusting variogram fans.
Selecting the direction of maximum continuity means selecting the direction on the variogram where a line drawn from the centre of the fan can reach furthest before it passes the sill. Any contours above the sill display in red (when using Supervisor's default colour scale).
Tips:
Before attempting to select the continuity direction, make sure that you have assessed your data and chosen the best data transformation or variogram type. See Variogram Types and Data Transformations.
Ensure that you have set the appropriate lag size for your data. There should be enough contours to clearly see trends on the variogram fan without it being too noisy. See Selecting the Optimal Lag Size for Variogram Modelling.
Below are some examples of variogram fans with the direction of greatest continuity selected.
Important: Always use geological knowledge to guide and confirm directional interpretation.
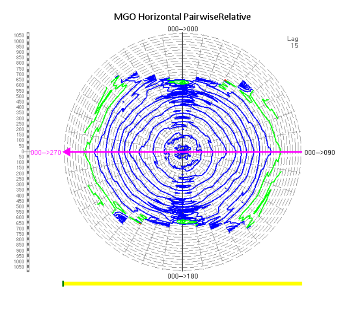
Example A
Data is only available over a narrow range. Even though the direction selected reaches the sill relatively quickly, the fact that data has only been collected along this direction indicates that the mineralogy may trend in this direction.
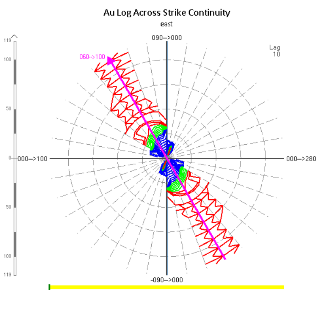
Example B
The direction chosen does not allow for the maximum distance before reaching the sill. However, it is important to consider the effective range of the data. That is, the range that you expect most samples to be used in the estimation itself. The scale on this variogram fan increases in 50 m intervals and for this particular deposit we only expect the effective range to be around 200 m. Taking this into account, we follow the structure observed in the blue contours, as it results in a steady increase to the sill within the effective range.
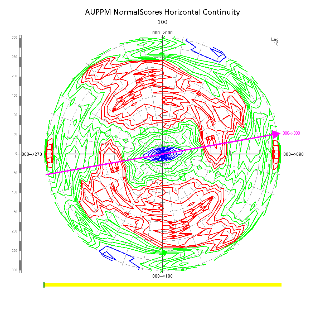
Example C
This variogram fan is omnidirectional. That is, there is no clear continuity direction and the relationship between data pairs is the same in all directions. In this case, the directional continuity analysis stage would be skipped and a stand alone variogram would be used. See Insert a Standalone Variogram.