
Edit Production (Bar Chart Method)
Activity steps:
- Locate the bar for the task in the Gantt Chart.
-
Ensure that the quantity you want to edit is displayed inside the bars.
Note: Hide and display labels using Bar Chart Options.
- Select the task in the spreadsheet.
- Use one of the following options:
- Edit ribbon >> Edit in Bar Chart >> Edit Period Quantity on Bar chart.
- Click the right mouse button while the cursor is over the bar and select Edit Period Quantity on Bar chart.
-
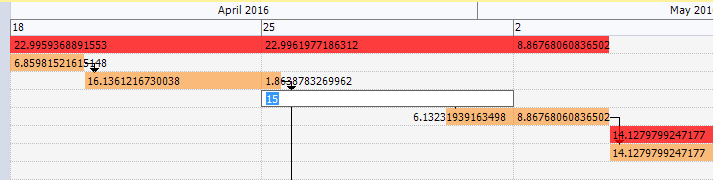
Change the quantity directly on the bar chart, for example:
- Use the left and right arrow keys to move to other periods on the bar.
- Use the up and down arrow keys to move to other tasks on the bar chart.
Related topics and activities