
Gantt Chart Area
The Gantt chart area shows a view of the schedule information within the Task Table.
When you create dependencies, this information is stored in the Task Table database and is displayed graphically in the Gantt chart area. Using these dependencies, the scheduling engine calculates Start and Finish dates for the activities and the associated Gantt Bars are then displayed in the Gantt chart area.
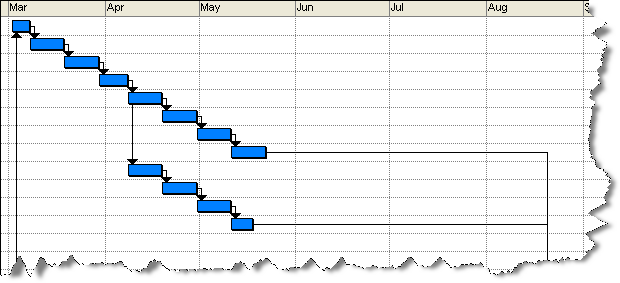
The Gantt chart area in DTS
Tip: If you are displaying field values in the Gantt bars, you can copy the contents of the Gantt Chart area to Microsoft Excel.
Related topics and activities