
Superimpose
The ![]() Superimpose ability is available from the Chart Files Explorer when selecting at least two folders or views. It allows you to merge graphics contained into different folders or views. It can mix views contained in a same chart file.
Superimpose ability is available from the Chart Files Explorer when selecting at least two folders or views. It allows you to merge graphics contained into different folders or views. It can mix views contained in a same chart file.
-
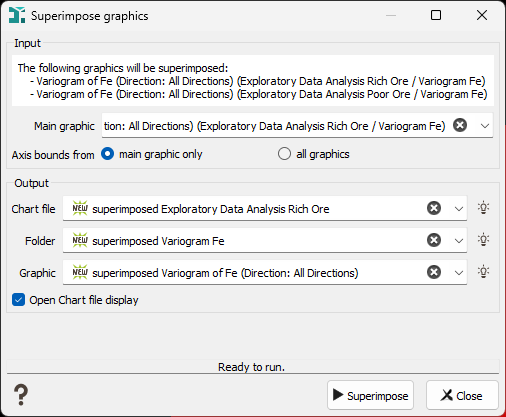
Input:
- The first box reminds the folders/views selected to be merged. This information is not editable.
-
Main folder / Main graphic: Choose amongst the different folders/views the one which will give main attributes to the destination graphics.
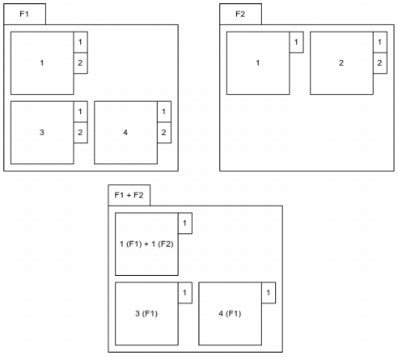
The main folder describes the layout of the output folder. Graphics are merged when they are at the same location in their parent folder:
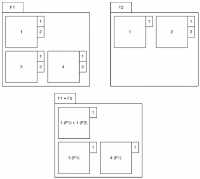
- Only the topmost tab graphics are considered for superimposition.
-
Only graphics whose the location exists in the main folder are merged. We only consider (in the superimposed new folder), the number of graphics and their location in the source one. Each graphic is merged by its positions with any topmost tab graphic in other folders.
-
Axis bounds from: Select from which graphic you want to define the axis definition.
- main graphic only: we use exactly the same axis bounds as the ones defined as the main graphic.
- all graphics: we define axis bounds in order to cover all graphics.
Note: Axis bounds can be customized through the Graphical Options available from the tool bar of each graphic.
-
Output:
- You define here the destination Chart file, Folder (and Graphic) giving their name. They can already exist or be created. If the specified folder/graphic exist, they will be overwritten but a message asking for confirmation will be popped up. The default destination folder/graphic will be named from the main source ’superimposed <source folder/graphic name>’.
- The Open Chart file display toggle enables to automatically display the generated Chart file after the run or the storage action in the batch. This option will not be saved in the batch.
Click Superimpose to finally merge the selected folders/views.
Some checks are made when superimposing several folders/graphics and a warning can be popped up in the following cases:
- If chart files contain graphics as (hidden/secondary) tabs, they will be ignored. Only visible tabs will be merged.
- If graphic positions in the selected folders are inconsistent, i.e. if some positions (views) are occupied in a chart folder but not in the other, some graphics will not be merged.
- If graphic bounds do not intersect at all.
- If the variables used in the graphic have different unit classes.