
Box Plot
The ![]() Box Plot item enables the computation of a box-plot from your selected variable.
Box Plot item enables the computation of a box-plot from your selected variable.
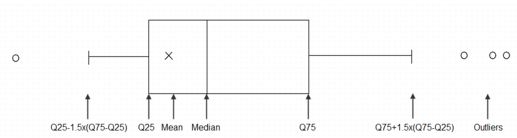
A boxplot is a convenient way of graphically depicting groups of data and of displaying differences between them through their six-number summaries: the smallest observation (sample minimum), lower quartile (Q25), median (Q50), mean, upper quartile (Q75), and largest observation (sample maximum). A boxplot may also indicate which observations, if any, might be considered as outliers.
Outliers are defined as below:
- all the values which are below Q25-1.5*(Q75-Q25)
- all the values which are above Q75+1.5*(Q75-Q25)
The result of the computed box-plots depends on the type of selected variable(s):
- if you select numerical variable(s), you will obtain in a unique view the associated box-plot(s) (one for each variable).
-
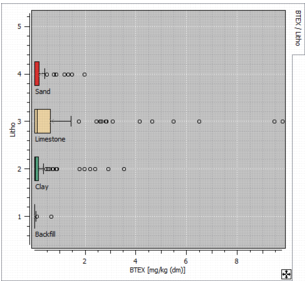
if you select a numerical variable and a categorical variable, numerical values will be sorted by category to compute the associated box-plot (one box-plot per category). All the box-plots defined for all the categories will be displayed in a unique view.
- Click Box color to open a Color Selector and select the color used to fill the boxplots. If you select a categorical variable, the boxplots will use the color of each category defined by the catalog.
- Select the option Display vertically (default option), respectively Display horizontally, to display the boxplots vertically, respectively horizontally, in the graphic page.
- Select Display outliers if you wish to display the outliers on the graphic. They will be displayed using the symbol defined in the Outliers symbols section. They can be highlighted and/or masked. This option is activated by default.
- Select Display number of samples to display for each boxplot, the number of data used to compute the different statistics. It will be displayed as text next to each boxplot.
- Tick Use log10 to see the boxplots with a Log10 scale for the vertical axis. (if boxplots are displayed vertically). This option may be of interest to correct the dissymmetric distribution that we can observe with a lot of low values and some high values.
- Select Reverse variable/category order to invert the order used to display variables/categories, i.e. from right to left if boxplots are displayed vertically or from top to bottom if displayed horizontally (same order as in the catalog for a categorical variable).