
Statistics
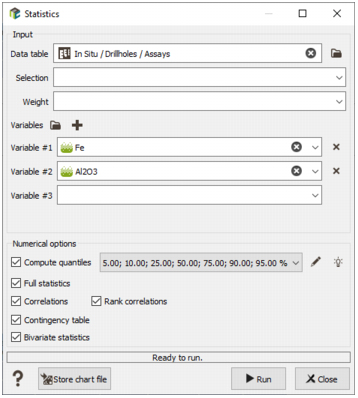
This Statistics application is designed to calculate standard statistics or declustered statistics on one or several variables of the same Data table (float, integer or categorical variables). A Selection variable can be applied to filter the samples on which the statistics will be calculated. Results will be displayed in the Messages window.
Declustered statistics are calculated using a Weight variable, the value read in this variable being used in the statistics as a weight for each sample.
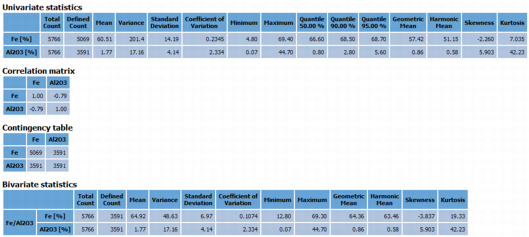
For each numerical variable selected, you will get:
- the total number of samples contained by the data table;
- the number of defined samples;
- the minimum value;
- the maximum value;
- the mean value;
- the standard deviation;
- the variance;
By ticking the dedicated option, Quantiles can also be calculated through a default list but quantiles of your choice can be defined. Click ![]() Edit to pop up the Value Definition window and customize the list of quantiles.
Edit to pop up the Value Definition window and customize the list of quantiles.
If the Full Statistics option is selected, additional statistics are displayed:
- the coefficient of variation (standard deviation/mean);
- the skewness (measure of the symmetry of the distribution: >0 for Lognormal, =0 for symmetrical distribution, <0 for inverse Lognormal);
- the kurtosis (measure the flatness of the distribution: <3 for distributions with important tails);
- the geometric mean;
- the harmonic mean;
Note: Refer to Statistical Equations for formula.
According to selected options, more statistics may be calculated and if several variables have been selected:
- Correlations: through a table summarizing the correlations between each pair of variables. By default, the Pearson correlation coefficient is calculated. This coefficient measures the linear correlation between two sets of data. Checking the Rank correlations option allows you to also calculate the Spearman rank correlation coefficient. It assesses how well the relationship between two variables can be described using a monotonic function. The Spearman correlation coefficient is of particular interest when the relationship of the two studied variables is not linear. By default this option is off as it requires the whole variables in memory.
- Contingency Table: when regarding two variables, a sample can be defined for one variable and for the other. The contingency table summarizes for each pair of variables the number of samples for which both variables are defined.
-
Bivariate Statistics: choosing this option, statistics will be computed, for each pair of variables, using samples for which both variables are defined only. This option is compatible with the Full Statistics option (i.e. Full Statistics will also be calculated on the same number of samples). This option gives access to univariate statistics too.
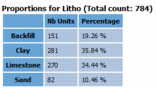
If a categorical variable has been selected, proportions (number of samples and percentage) will be calculated for each category.
-
Click
 Store chart file to save the generated tables in a Chart File.