
Upscaling
The Upscaling task is designed to upscale input variables on a grid file, whether using simple variables, results of an estimation for example, or macro variables, as simulation results. Both estimated variables and macro-variables can be processed, allowing the derivation of post-processing–like outputs and enabling users to assess and quantify uncertainties on the upscaled results. The task supports different approaches to adapt to different needs: it can rely on a moving neighborhood approach, including anisotropic searches. It also provides a panel-like approach, for aggregating fine-scale statistics into coarser blocks (e.g., SMUs to panels), as well as a categorical mode dedicated to computing cumulative statistics by category such as lithologies or domains. By incorporating weighting variables and handling constant or variable densities, it provides a flexible and efficient way to generate reliable upscaled results.
Input
- Click the folder icon to pop up a data selector and select the Grid which contains the estimated / simulated grades. It can be a 2D or 3D grid. The data table can also be defined by a simple and quick drag-and-drop from the Data tab.
- A Selection variable may be specified. In this case, only the samples defined by the selection (i.e. samples where the value of the selection is equal to 1) will be considered for the calculations. This selection can also be defined by a categorical variable.
- You can also select a Weight variable (optional) to calculate weighted statistics. Be careful, there is only one weight variable, which applies to all the defined variables. Blocks associated with a negative or zero weight or undefined will be skipped.
-
Then, you have to choose between different modes for the Density: None, Constant (2700 kg/m3 by default) or Variable that will be used as a factor when calculating the Q, T and M variables.
- In 3D, the Density factor is applied to compute masses. In the case where the density is defined by a variable, the selected variable should be associated with a Mass density unit class.
- In 2D, a Thickness factor can also be set. The thickness can be a constant value or defined by a variable. In this last case, the selected variable should be associated with a Length unit class.
Depending on the type of the variable, the result can be homogeneous to a tonnage for a grade, or a volume for a thickness in 2D for example.
- To finish, select the Main variable to be considered for the upscaled calculations. It can be a simple numerical variable, as a kriging result for example, or a macro variable in case of simulations. Additional variables to upscale can be selected through the Auxiliary variables. As for the main variable, you can set a simple variable or a macro variable but this one should have the same indices as the main macro variable. The variables must be consistent (all simple variables or all macro variables).
Parameters
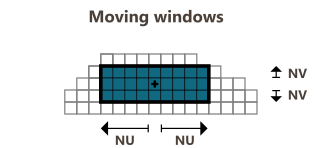
Moving
The Moving mode defines a neighborhood centered on each input grid cell. The neighborhood is specified by a fixed number of cells. The neighborhood is rectangular and requires the definition of an extension around the cell of interest in each direction U/V(/W). A feedback is provided to display the actual number of cells in the window based on the specified extensions.
Fine-to-coarse
The Fine-to-coarse mode computes statistics of a fine-scale grid on a coarser grid, provided the two grids are geometrically compatible (2D/3D and same rotation). This approach is equivalent to using the Copy Statistics algorithm with zero extension.
- Click the folder icon to pop up a data selector and select the Coarse grid on which you want to compute the upscaled statistics. The grid can also be defined by a simple and quick drag-and-drop from the Data tab.
- A Selection variable may be specified. Only the cells of the coarse grid inside the selection will be considered to calculate the different statistics.
-
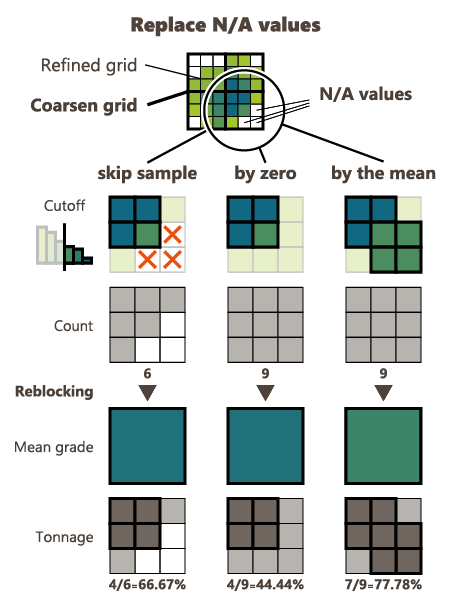
Replace undefined values: If for some reasons, some fine-grid cells are not informed (the estimation / simulation returned N/A), these cells can be skipped (default option) or they can be patched with a grade equal to zero or patched with the mean of the associated coarse cell.
Categorical
The Categorical mode computes aggregated statistics by category, based on a Categorical variable defined on the input grid. Each category (e.g., lithology or domain) is used to group the data, and the statistics are calculated on the aggregated values for each group. If output variables are stored, the corresponding statistics are copied to all cells belonging to the same category.
Output
The objective of the Pattern (and Context) parameter is to help the definition of output results names. You can edit this pattern and define the name of your choice. Click on ![]() to retrieve the default pattern: %context-%var-%label
to retrieve the default pattern: %context-%var-%label
The Label section is editable by a double-click for modification. The Preview enables you to see the final name associated to each output result (for the main variable).
Note: In the case of macro variables, the first step always consists in computing the upscaled mean for each realization. The statistical quantities requested as output are then calculated from these upscaled means.
You may then specify several output variables grouped in three different tabs:
-
General: Under this tab, you will find main statistics (mean value, standard deviation, variance, coefficient of variation, minimum or maximum of the realizations of the target variable and quantiles).
- Mean: gives the mean value of all fine-grid cells selected according to the chosen upscaling mode - whether these cells are grouped within a coarse-grid cell, aggregated by category, or gathered in a moving neighborhood.
- Standard deviation / Variance: gives the standard deviation / variance of all fine cells that belong to the group defined by the chosen mode.
-
Coefficient of variation: corresponds to the ratio of the standard deviation to the mean.
- Minimum: gives the lowest value among the selected fine-grid cells.
- Maximum: gives the highest value among the selected fine-grid cells.
-
Quantiles: gives the values that split the distribution of the selected fine-grid cells into specified proportions.
Click
 Edit to pop up the Value Definition window and customize the list of quantiles.
 - Mean (per real.) (only if a macro variable is provided as input): gives the upscaled mean for each realization. This result is directly used to compute the different statistics. It is stored in a macro variable (with the same number of indices as the main variable).
- Count: gives the number of fine-grid defined cells included in the calculations.
- Upscaled volume/area (only available for the Moving mode): gives the total volume (in 3D) or area (in 2D) (cumulative sum) represented by the fine-grid defined cells selected by the neighborhood.
Note: When selecting a macro variable as input, the different statistical results are computed in two steps: the first step consists in calculating the upscaled mean for each realization, and the second step computes the requested quantity/statistic by considering the macro variable containing these upscaled means.
-
Thresholds: Under this tab, you will find results associated with threshold(s). All of these outputs are stored in macro variables, one index being associated with a cutoff. When defining several thresholds, the two following options appear:
- Above a threshold: Select this option if you want to consider values greater or equal to a defined threshold.
- Between two thresholds: Select this option if you want to consider values within an interval defined by two thresholds, i.e. values greater or equal to the lowest threshold and strictly lower to the greatest threshold.
Click
Edit to pop up the Value Definition window and customize the list of thresholds.Note: When considering several variables (a main variable and auxiliary variable(s)), the defined threshold(s) will be applied to the main variable only. Other auxiliary variables will not consider threshold(s).
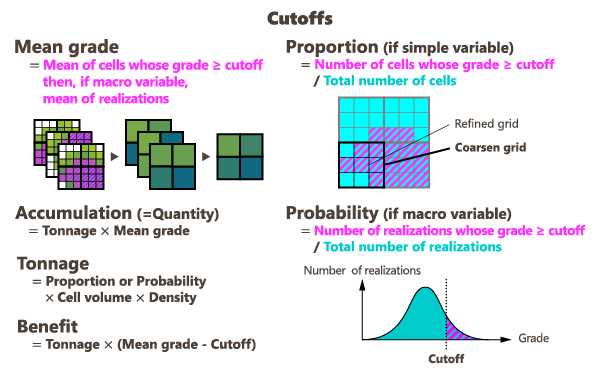
- Mean grade: depending on the selected mode, for each cell defined by the moving neighborhood, the coarse grid, or the category, the program calculates the average of fine-grid values that are greater than or equal to the threshold (or that fall within the interval in the case we consider two thresholds).
-
Accumulation: depending on the selected mode, for each cell defined by the moving neighborhood, the coarse grid, or the category, the program calculates the average of fine-grid values that are greater than or equal to the threshold (or that fall within the interval in the case we consider two thresholds), multiplied by the area or the volume of the cell.
In 3D, this result is also multiplied by a Density factor to compute masses.
In 2D, a Thickness factor can also be applied if defined.
Depending on the type of the variable, the result can be homogeneous to a tonnage for a grade, or a volume for a thickness in 2D for example.
- Tonnage: corresponds to the rock quantity (in weight) where the upscaled value is greater or equal to the threshold value (or within the interval in the case we consider two thresholds).
-
Benefit: corresponds to the difference between the metal quantity you should obtain with the calculated grade and the metal you would have obtained if the blocks had the exact cutoff value, so a value lower than the grade value.

Note: If the input variable is not associated with any unit class and a density is defined, the input variable will be considered as expressed in ppm. Consequently, the accumulation, tonnage, and benefit results will be calculated as masses.
- Proportion (only if a simple variable is provided as input): represents the proportion (between 0 and 100%) of fine-grid cells which are greater than or equal to the threshold (or within the interval) to the total number of cells inside each coarse cell, inside the category, or gathered in the moving neighborhood, depending on the selected mode.
- Probability (only if a macro variable is provided as input): for each node of the grid, the program computes the number of realizations where the value is greater than or equal to the defined threshold or within the two defined thresholds. When normalizing this value to the total number of realizations, this gives a probability (between 0 and 100%) for the node to exceed the defined threshold.
Note: Unlike other statistics, when a macro variable is defined as input, the comparison with the cutoff(s) and the resulting calculations are performed on the fine-grid cells for each realization, in order to preserve as much variability as possible. These results are then averaged across all realizations.
-
Uncertainty: This tab is visible only if a macro variable is provided as input. The following results are computed in two steps: the first step consists in calculating the upscaled mean for each realization, and the second step computes the requested quantity by considering the macro variable containing these upscaled means.
-
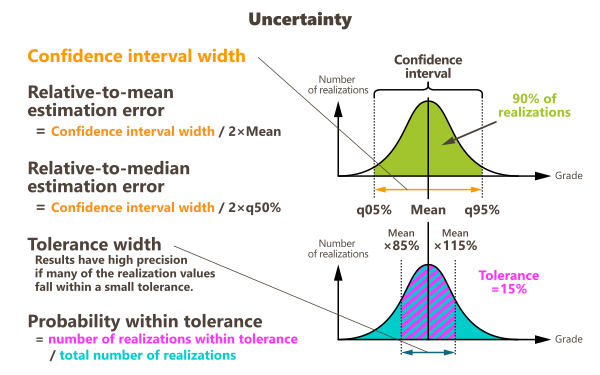
Confidence interval width: the confidence interval map represents the width of the interval which contains the real value at a given confidence level. For each node of the grid, simulated values are sorted in increasing order to compute quantiles (a quantile is always one of the simulation values of the macro variable). The p% confidence interval is based on the computation of two symmetric quantiles:

Click
Edit to pop up the Value Definition window and customize the list of confidence intervals. -
Relative-to-mean estimation error: corresponds to the ratio of the confidence interval width to the mean multiplied by two:

-
Relative-to-median estimation error: corresponds to the ratio of the confidence interval width to the median

-
Tolerance width: combined with the probability within tolerance variable, this result is used for the Parker's classification.

Click
Edit to pop up the Value Definition window and customize the list of tolerances. By default, the tolerance is set to 15%. -
Probability within tolerance: for each node of the grid, the program computes the number of simulations whose value lies in the interval defined by the mean value more or less the tolerance. When normalizing this value to the total number of simulations, this gives a probability (between 0 and 1).

-
-
Order statistics table: This option is only available for the Categorical mode. Statistics printed in the table can be ordered:
-
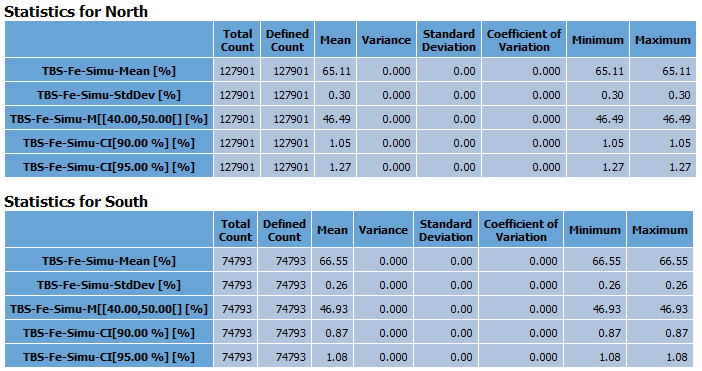
By variable: In this case you will have one table for each output variable with one line of the table per category (plus one if some samples have an undefined category).
-
By category: In this case you will have one table for each category (plus one if some samples have an undefined category) with one line of the table per output variable.
-
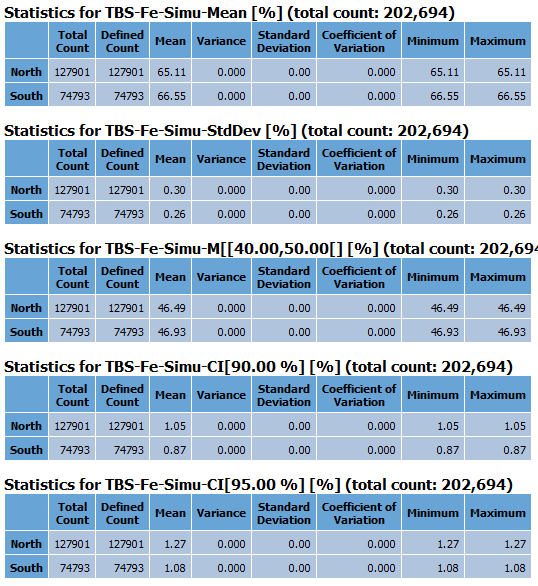
- At the end of the run, statistics on the output variables are printed in the Messages window. Check the Only print a table in Messages (variables won't be saved) option if you don't want to store any variable and just print the statistics. You can click on the Store chart file button to save the statistics table in a Chart File.
- As some results are saved in macro variables, these ones can be overwritten if they already exist by checking the Overwrite macro option. Otherwise, results will be appended (i.e. new indices will be added in the existing macro variable).