
Histograms: Format
To access this screen:
-
Open the Histogram screen, select the Format tab.
This Historgrams: Format screen is used to control the histogram model, bin size, grid, axes and color parameters.
To configure these settings:
-
In the Model group, configure the histogram model controls:
-
Check Fit Model on All Charts to fit and display histogram models on all listed histogram charts.
-
-
Select Custom Bin Size to define custom bin size values:
-
Set Bin Size for All Charts to define a bin size value.
-
-
In the Grid group, select the grid line Style and Colour for the X and Y axes using the drop-down lists.
-
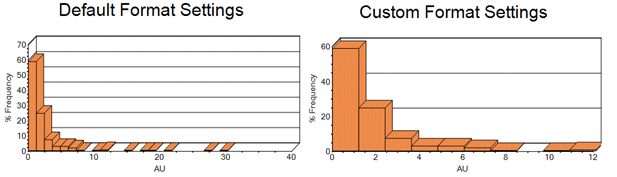
In the Axes group, choose default or custom axes options and their parameters:
-
Check Use Default Axis to use default X and Y axis minimum, maximum and interval options for all charts.
-
Check Use Custom Axis to define custom minimum, maximum and interval options for each Chart Type.
-
Use the Chart Type drop-down to select a chart for custom axes definition. This drop-down is only available if the Use Custom Axis option is selected.
-
For each Custom Axes chart type, define the corresponding custom axes parameters. The fields below are automatically populated with suggested values to ensure that all graph details are initially visible.
-
Check X Axis to define the custom X axis parameters.
-
Check Y Axis to define the custom Y axis parameters.
-
Set the Minimum value for the corresponding axis. This must be a numeric value that is less than the Maximum.
-
Set the Maximum value for the corresponding axis. This must be a numeric value that is greater than the Minimum.
-
Enter Interval to specify the interval spacing between value labels on the corresponding axis. This parameter cannot be customized for Y axes intervals.
-
If the custom axis option is used, it is possible to create a value range that does not include all values in the selected object or file.
In this situation, you can control how these values are handled (ignored or pushed into the first/last bin) using the Data Selection tab. If values are changed, clicking Apply will update the chart preview using the new settings.
-
-
-
In the Color Palette group, choose histogram chart colours.
-
Select a colour palette for Individual Charts from the drop-down.
-
Select a colour palette for Compound Chart charts from the drop-down.
-
-
Check Charts Annotation Size to define custom annotation font size settings.
-
Select a font size for the Title from the drop-down.
-
Select a font size for the Legend from the drop-down.
-
Select a font size for the X Axis from the drop-down.
-
Select a font size for the Y Axis from the drop-down.
-
-
In the Options group, choose any additional histogram chart formatting controls.
-
Check Display Data Set Name in Histogram Title to display the loaded data or data file name as a suffix in the histogram title.
-
Related topics and activities: