
Add Report Projections
This is the fifth of a series of activities relating to field map reporting configuration.
Warning: This topic is intended for Studio Mapper system administrators. You should not attempt any of the following procedures unless you are confident to do so, and are familiar with the concepts described.
This topic assumes some familiarity with the Plots window and Plots window templates.
Typically, an output field mapping report will contain a plan of at least one map face. This can contain a range of different data types. Reports can contain multiple projections, including an unfolded 'butterfly map' representation.
This activity describes how to add projections to your plot template that represent particular map faces. These projections reference entries in a previously-created section definition file.
A projection representing the current 3D view (orientation, scale etc.) can also be added to a report. In this situation, the 3D window is oriented as required prior to generating a report. In Studio products, there are two basic categories of plot projections:
-
2D Projections — projections that are a 'flat' representation of the corresponding view in the primary 3D window. These projections can be adjusted to rotate the view, but don't support all of the formatting options of the 3D window. These are legacy projection types, introduced early in the Studio product timeline.
-
3D Projections — introduced later than 2D projections, these projections are very similar to embedded 3D windows, including the way overlays are formatted and how the view direction is set.
Note: the projection type must be specified in your system configuration file using the <UseAutomaticOverlayMode> tag. This setting applies to each map type.
Studio Mapper reports can integrate both 2D and 3D projections and even a combination of types within the same report.
Although it isn't mandatory, the linked activity also describes how to insert a Title Box plot item to the report template.
Warning: updating the system configuration file will affect all Studio Mapper projects with which it is associated. Changes should only be made if you are familiar with the XML format, and changes should be tested in an appropriate environment before rolling out to a live system.
To create projection reference objects for a FACE mapping report:
-
In Studio Mapper, open a project linked to the database that contains data you wish to represent in your report.
-
Display the primary 3D window.
-
Drag and drop the map_faces.dm file from your database's Templates folder into the 3D window.
The section definition table is loaded.
-
Decide which map data types will appear in your plot projections (and subsequent reports). You don't have to include them all.
-
Open the Plots window.
-
Select Plots >> Manage .
-
Insert a new plot sheet of the required dimensions (e.g. select Sheet >> Plan and use the Page Setup function to set up the required report page size):
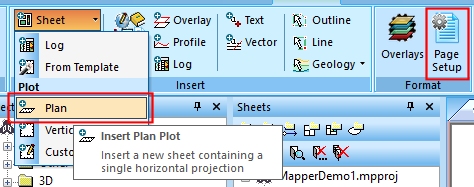
(The projection may contain a view of the data in the map or 3D window - this can be ignored as you're going to change the projection definition shortly). -
Enable Page Layout mode and resize the plan projection to the size you need for a face plot. Also position the projection where you would like the face plot to appear.
-
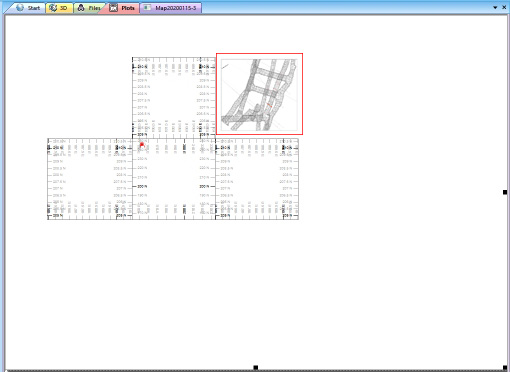
Insert, resize and reposition other face projection items using Add Projection >> Section or by copying and pasting the previous item. How many you add will depend on how many faces you wish to display in your report. In this example, four will be added.
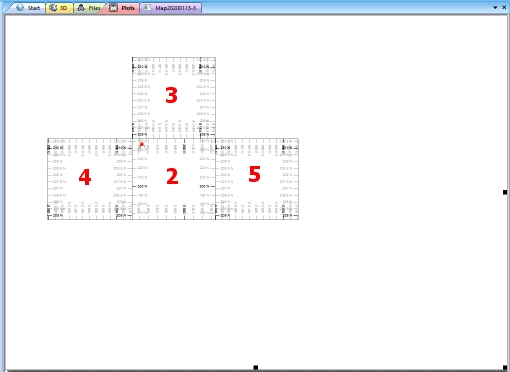
For this example containing the section definitions Front, Top, Left and Right (in that order), you could set up the following arrangement:
-
For the front face (2), right-click anywhere within the projection plot item (e.g. (2), above) and select the ...Properties option.
-
Using the Projection Properties screen, scroll down to find the Sections Table group.
-
Set Use section table to Yes
-
Set Sections Table to map_faces.
Note: If you have more than one section table loaded, you will be asked to select one. If so, pick your map_faces section definition table and click OK.
-
Scroll down until you see the Section Number setting and change it to [2], e.g.:
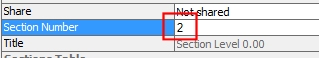
The number represents the position the face is in the top-bottom order in the Sheets control bar's Sections folder (including the LOCATION item). You just set up the FRONT face, which is the second one in the list: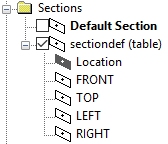
Note: It is important to associate each projection with the correct section number, otherwise map face data may appear in unexpected places in the output report.
-
Click OK to dismiss the Projection Properties screen.
-
Add new projections for other faces you wish to appear in your PDF report. For example, if TOP, LEFT and RIGHT are also needed, create projection settings as follows:
-
TOP: Section Number = 3, suggestion: position the projection above the FRONT projection.
-
LEFT: Section Number = 4, suggestion: position the projection to the left of the FRONT projection.
-
RIGHT: Section Number = 5, suggestion: position the projection to the right of the FRONT projection
-
Projections are now associated with the record index of a section definition, such as shown below (red text section numbers added for illustration only):
- To add a 3D reference projection for georeferenced maps (that is, one that represents the current view direction of the 3D world window):
Activate the 3D world window.
- Rotate and pan your view of georeferenced data in the 3D world window. At this point, it's the view direction that is important.
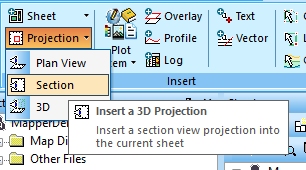
- Activate the Plots window.
- Add another projection using the Manage ribbon's
Insert >> Projection >> 3D
option.
Position and scale the 3D projection as required, using the Projection Properties screen, e.g.:
Define appropriateAlign with section, Drawing Order and Section Clipping properties for your 3D section.
Dismiss the Projection Properties screen.
Save your project.
Next, see Assign Project Overlays.