
User Interface
Your application's user interface is design to be flexible and simple to use. You can customize just about every part of it.
A ribbon system is used to deliver key functionality, whilst control bars help you to work with specific project data, including strategic planning and reference data.
See Ribbons.
Control bars are provided that are dedicated to a particular element of your system, such as the optimization workflow, accessing and formatting project data. 3D data can be displayed in a variety of ways using a range of data windows. There are also tool bars, strategic results tables and charts and more.
Tasks Pane
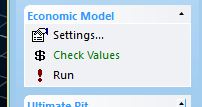
This control bar contains managed workflow tasks for Optimization, Reports, Visualize and Notes. You'll use it a lot when developing planning projects.
See The Tasks Pane.
Data Windows
As in previous versions of Studio, dedicated (linked) data windows are provided to deliver the most appropriate context for the type of work being performed. By default, the following data views are displayed:
-
Start Window – Unless you have launched your application directly from a project file, the Start Page is the default view. The Start window is displayed on initial startup and is available throughout your project session. It can be used to view the latest online or offline information relating to your product, access recently-opened projects, create a new project or browse for a project.
Note: Swap between online and offline modes using System Options >> Use Online Systems.
-
Summaries, Reports and Charts – The results of each phase of your strategic planning project. Summaries and reports are presented in a spreadsheet-style view and chart windows support these results.
See Summary Results.
-
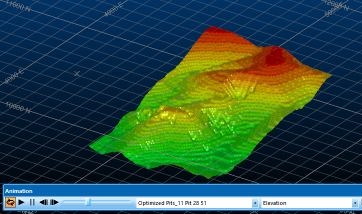
3D Windows – 3D windows offer a combined visualization and engineering interface to complete your CAD-style engineering tasks in a flexible environment. Many interactive commands are available to make the geological modelling process intuitive and rich in 3D visual feedback. A 3D window also allows you to spawn independent, floating versions of the 3D view.
See 3D Windows.
See External 3D Windows.
-
Plots Window – Report-ready plots, logs, charts and other supporting data can be constructed from your 3D data quickly and easily with the Plots window. Working with the same data displayed in other data windows (including 3D), and with a powerful template function, you can create detailed and unequivocal standard reports in minutes.
See Plots Window.
Other data windows are displayed either on request, or automatically as a result of creating a particular type of data:
-
Logs Window – Strip log display and configuration, again based on the same underlying data as shown in other data views. This window is automatically displayed when a new Log Sheet is created, and will be automatically displayed if a project containing log data is loaded.
See Logs Window.
Control Bars
Control bars are a great way to access data-specific functions and processes. Some of these controls bars, such as the Project Map Control Bar and Project Database Control Bar are unique to your application and provide a view of the data generated by the Optimization Workflow.
Other bars are more general and common to all Studio products:
-
See Data Control Bars.
-
See Output Control Bars.