Unfolded Variograms & Search Parameters
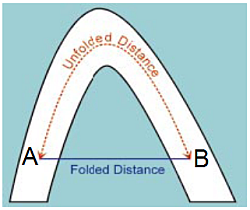
UNFOLD is a grade estimation technique where folded orebodies are unfolded to reduce structural complexity. When an orebody is folded in the world coordinate space (WCS), spatial relationships are reduced which means that traditional linear estimation techniques may not do a good job at grade estimation (because mineralization occurred before the rock was folded).
Variograms in the unfolded space removes the dimensionality of a folded structure, resulting in more spatial continuity so variograms might be smoother and have longer ranges. Unfolded distances in the unfolded space represent ”true” distances between samples prior to deformation.

Variogram analysis is performed in the UCS, with the parameters of the variogram model calculated in the UCS. A model with cells and subcells within the folded stratified unit can then be defined using the world coordinate system.
Note: An alterantive way to create variogram models is to use Datamine Supervisor (making sure to use the unfolded sample file with the coordinate fields UCSA as X, UCSB as Y and UCSC as Z, and import these variogram models into Advanced Estimation in the Supervisor Project Import on the Scenario Setup tab.
Create Unfolded Data Variograms
To create variograms of unfolded data using the Advanced Estimation console:
-
Open the Advanced Estimation console.
-
Define unfolding parameters for your scenario. See UNFOLD in Advanced Estimation.
-
Once the parameter file has been defined and unfolded data reviewed, Activate the Investigate Anisotropy tab.
The parameters on this panel create a variance map for identifying anisotropy.
-
Use the Select zone and Select variable lists to define the scope of investigation.
-
Choose lag and block settings. See Investigate Anisotropy.
-
Click Create 3D Map to generate the variogram map.
Note: The variography uses the coordinates set on the Select Samples tab. These coordinates need to be set to UCSA as X, UCSB as Y and UCSC as Z to ensure the variogram map and variogram models are from the Unfolded samples.
-
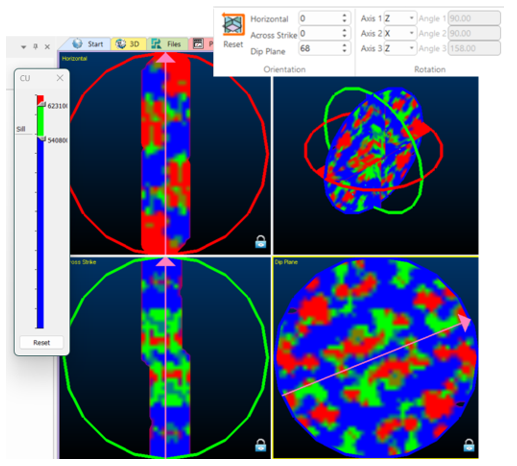
The 3D window displays the unfolded samples with the variance map. In this window, confirm that the chosen rotation aligns with the unfolded data and the unfolded data lies on one of the planes.
Unfolded data may align with the principal axes, which is the desired outcome as dimensionality is removed through unfolding. In the 3D window panels, the horizontal, across strike and dip plane orientations may be interactively adjusted by dragging the pink arrows to the orientation where the greatest varianges is seen in the middle. The lag legend may be adjusted using the Show Legend control. See Investigate Anisotropy.
Variography shown with respect to the major axes of the unfolded data
-
Once the orientation of the horizontal, across strike and dip plane are determined, the rotation around the axes are display in the ribbon.
Once complete, return to the Create Variogram panel in Advanced Estimation.
-
Switch to the Create Variograms tab. In this tab, the grade fields and zones should be checked.
-
The Reference Plane Rotation is set from the 3D variogram map by clicking Read from 3D map window.
If required, variogram parameters may be adjusted – for example, increasing the Tolerance of the horizontal or vertical direction, adjusting the maximum distance, minimum / downhole lag or setting a cylinder radius. See Create Variograms
-
Click Calculate Variograms to create the variograms for estimation.
-
Complete the remainder of the Advanced Estimation console panels and run your estimation.
Related topics and activities


