|
|

Contours from Points - Procedures
Your product contains functionality to generate contour strings from an input points data object.
Contouring is the process of tracing contours - lines of equal z-value (such as grade, elevation, seismic travel time or drillhole intercept positions) - on a grid for representation of the surface on a map.
Contouring Point Data
The input to this function is a loaded points object. The command optionally generates an output string file containing contours at nominated elevations, a grid and/or a wireframe surface object.
For more general information, see Contours from Points - Introduction
|
|
This function will default to overwriting the current object (string, model or wireframe) when it outputs data. You can create your own objects as part of this procedure, or you can choose to create the output objects manually first (using the Current Object toolbar) then select them on the Output Data screen. It's up to you. |
Procedure 1 - Grade Contours from Points
Grade contouring is one key application for the generate-contours-from-points command. Grade contours generated in this way loosely mimics the processes of grade interpolation in processes such as GRADE and ESTIMA, and other interactive functions Studio products, including Advanced Estimation.
The same interface is used to produce both grade- and elevation-maps (the following procedure), and both rely on a loaded points object to exist in memory.
The procedure is general, but theoretical data is displayed:
- Load the points file containing sample grade information into
the 3D window, e.g.:
- Launch generate-contours-from-points.
- If the data you loaded in step 1) is the only points object,
it is already selected. Use the Contour
attribute drop-down list and select a grade attribute.
Alternatively, if you wish to use a subset of any of your loaded data (points, faults and/or clipping polygons), select data for each type then enable the Selected Points option and click Store Current Selection. This creates a sub-sampled object ready for processing. You will need to do this independently for each data type.
Selected data is committed when the Store Current Selection button is pressed. However, any items deleted from that selection by the time the Next button is pressed will not be processed: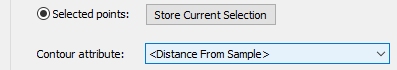
Switching away from Selected points to Object will purge the selection storage (to save memory and avoid the overhead of maintaining the references). You will need to resubmit your choice by clicking Store Current Selection if you change your mind.
For each object type, a read-only field shows you the number of entities that are currently selected. - Click Next to display the Generate Contours – Gridding panel.
- The Gridding page is displayed. The Extents section determines the scope of your contouring. Choose to use the current data extents to define the bounds of your output contour data, or specify your own minimum and maximum values.
- The Margin setting
is the amount by which the contours (and surface) are extended
beyond the original data hull. This option is only available if
Use data extents is enabled.
The Margin is added to
the data extents before copying the Min
and Max values shown.
The generated grid always uses the Min and Max values regardless or any intermediate changes to margin (although the actual grid max may be rounded up to the next whole cell size).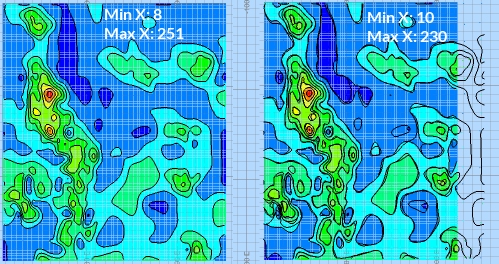
- The Resolution area
lets you define the grid cell size or number of grid cells. This
increases or decreases the distance between grid points. This
example procedure doesn't output a grid model, but if it did:
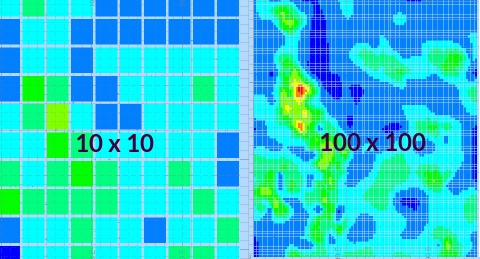
- If setting the Cell Width and Height, higher numbers will reduce the inter-point distance of the grid.
- If setting the number of Cells Across and Up, higher numbers increase the distance.
- Estimation parameters determine how the surface is generated
between points. The options are:
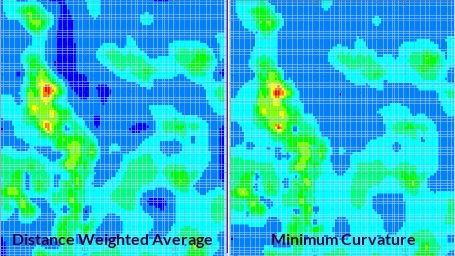
- Distance Weighted Average: the estimate is the average of sample values used by weighting the inversely to the square of their distance from the node.
-
Minimum Curvature: this is also an inverse distance weighted average method, but also uses slope information at the node being estimated.
-
Trend Surface: use a polynomial projection method to interpolate a trend surface between points. Select the polynomial order to determine the type of calculation performed.
-
Set your estimation method. For the majority of cases, the default [Slope] setting is fine.
-
Similarly, there are multiple Smoothing options available for your contours (this will have no effect on the output grid model). The [Biharmonic] option will apply a sensible smoothing level to most inputs and parameters e.g.:
-
Click Next to display the Output Data screen.
-
Determine the distance between contour elevations using the Interval setting. If you wish to offset the intervals from the factor positions of the min-max range, you can.
-
You can output contour data within a given range, or you can use the data limits to set the Highest and Lowest elevation values.
If you wish to constrain the contours generated to upper and lower values, select the Custom option and set the Lowest and Highest value accordingly. The Interval does not have to be a precise factor of either the Lowest or Highest value. -
If you want to fine-tune your output, you can use the Options. More...
-
Enable the Output grid object – this means a block model will be created, interpolating between the loaded points.
-
The default setting - Below data - ensures the model sits below the generated contour strings if they have a positive Elevation value. If you like, you can choose the model to be positioned between a minimum and maximum elevation (effectively, changing the size of the 1-cell-deep model height).
-
If you wish to output a wireframe surface that is an interpolation of your contour strings, select the Output surface option.
-
Click Finish and review your results.
Procedure 2 - Elevation Contours from Points
In this example, you will create a series of contour/elevation strings from a loaded points file representing a topography. A 3D surface is generated, and both strings and surface will be clipped using an external string file containing 2 separate polygons.
The procedure is general, but theoretical data is displayed:
- Launch your application and create a new project, or open an existing one.
- Load points data that contains an attribute with a unique keyfield
value to be modelled. If you wish model faults and/or clip your
output, load fault strings and clipping polygons as well. In this
example a points file and clipping polygons are loaded:
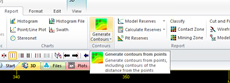
- Run generate-contours-from-points
or, using
the Report ribbon,
select Contours | Generate
Contours:
- The Generate Contours – Input Data screen is displayed.
- Select your Contour attribute.
This should be the value that represents the structure you wish
to model. It can be numeric or alphanumeric. For elevation-based
contours, the [_Z_Coord] virtual field is the one to use, and
it is selected by default if it exists in the loaded point data
object.
This is where you define your input points and (optionally) faults and clipping strings objects. - To use all of your loaded data when generating contours, make
sure no data is selected in the 3D
window (you can use the Home
ribbon's Deselect menu
options to be certain).
Alternatively, if you wish to use a subset of any of your loaded data (points, faults and/or clipping polygons), select data for each type then enable the Selected Points option and click Store Current Selection. This creates a sub-sampled object ready for processing. You will need to do this independently for each data type.
Switching away from Selected points to Object will purge the selection storage (to save memory and avoid the overhead of maintaining the references). You will need to resubmit your choice by clicking Store Current Selection if you change your mind.
For each object type, a read-only field shows you the number of entities that are currently selected.
You cannot generate distance contours with this command, instead, use the Distance Contours command. - Click Next to display
the Generate Contours – Gridding
panel:
Data is now committed for contouring. Any changes made to your loaded data after this point (e.g. deleting all the input points, or even the input points object), will have no effect. If you wish to absorb changes made to data since Next was clicked, it is necessary to Cancel and restart the wizard. - The Extents section
determines the scope of your contouring. By default, the minimum
and maximum values of the loaded points file are used (Use
data extents selected). You can add a margin to this to
extend your output data beyond the confines of the loaded data
limits if you wish. You can also select a Custom option to set
your own output data limit values in X and Y.
The generated grid always uses the Min and Max values regardless or any intermediate changes to margin (although the actual grid max may be rounded up to the next whole cell size).
For example: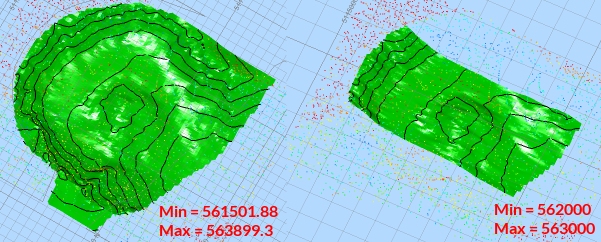
- The Resolution area lets you define the grid cell size or number of grid cells. This increases or decreases the distance between grid points. This example procedure doesn't output a grid model, but if it did:
- If setting the Cell Width and Height, higher numbers will reduce the inter-point distance of the grid.
- If setting the number of Cells Across and Up, higher numbers increase the distance.
- Estimation parameters determine how the surface is generated between points. The options are:
- Distance Weighted Average: the estimate is the average of sample values used by weighting the inversely to the square of their distance from the node.
- Minimum Curvature: this is also an inverse distance weighted average method, but also uses slope information at the node being estimated.
-
Set your estimation method. For the majority of cases, the default [Slope] setting is fine.
-
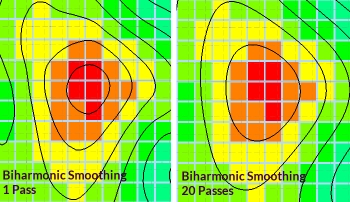
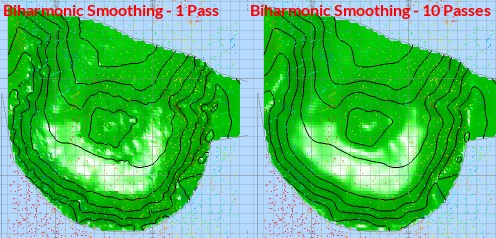
Similarly, there are multiple Smoothing options available. The [Biharmonic] option will apply a sensible smoothing level to most inputs and parameters. If you wish, you can change the Smoothing passes to increase the level of smoothing, at the expense of processing time:
- If you wish, you can define a search ellipse to imply anisotropy. The [Minimum Curvature] algorithm is not ideal for using with a search ellipse and may produce some extreme values. [Distance weighted average] is recommended if using an ellipse. In the absence of a search ellipse, native contouring methods are used. These are not the same as an infinite search ellipse, and will produce different results.
- Click Next to display the Generate Contours – Output Data screen.
- Make sure Output Contour Strings is selected.
- Set your contour Interval and Offset.
- By default, the current data limits determine the size/extent of output 3D data, but you can limit the scope of contour strings if you want, using the Custom option; the Lowest and Highest fields will default to the minimum and maximum values for the attribute to be contoured, and can be considered to be the same as applying an upper and lower bound on the contouring values.
- In the Output section, enter a name for your output contour strings object (overtype whatever is there) and select the radio button next to the drop-down list.
- As you are creating an elevation contour map, make sure [Use attribute] is selected. This ensures the contours elevations are based on the Contour attribute value you set earlier (_Z_Coord).
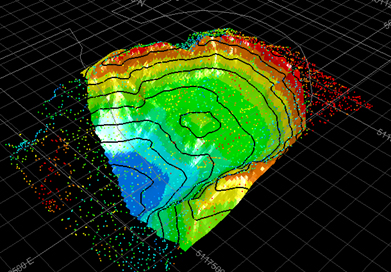
- Enable Output Surface and type a new surface name (again, overtype what is there). Select the radio button next to the drop-down list.
- Click Finish to create
the contour surface and strings e.g:
- For clarity, you could color the surface using the _Z_Coord
default legend:
Procedure 3 - Distance from Samples Procedure
This section outlines a general procedure for creating a "distance-from-samples" contour map. This map indicates the proximity of each grid model cell to a known sample point.
The example given is for a flat map (no variability in Z). An output contour strings object and grid model are created. The procedure is general, but theoretical data is displayed:
- Launch your application and create a new project, or open an existing one.
- Load points data. In this case, it is the location of the points that is important, not the supporting attributes.
- Launch the generate-distance-contours command, or activate the Report ribbon and select Contours | Generate Contours | Generate Distance Contours.
- Click Next.
- The Gridding page is a simpler version of the screen displayed during elevation and grade contour modelling.
- The Min and Max values displayed are those
calculated from the input data (or subsampled selection). By default,
the input data determines the extent of sampling, which means
the Margin setting can
be used to set the amount by which the contours (and surface)
are extended beyond the original data hull. The Margin
is added to the data extents before copying the Min
and Max values shown.
The generated grid always uses the Min and Max values regardless or any intermediate changes to margin (although the actual grid max may be rounded up to the next whole cell size).
Adjust the settings as required. - The Resolution area
lets you define the grid cell size or number of grid cells. This
is like the NGRID parameter
used in implicit modelling commands; it increases or decreases
the distance between grid points. This example procedure doesn't
output a grid model, but if it did:
- Click Next to progress to the Output Data screen.
- Set the Interval and Offset for the output distance map.
- By default, the loaded data extents are used to determine
the hull of the output contours strings, so the Lowest
and Highest values represent
the minimum and maximum possible distance for the selected data
set. You may need to adjust the Highest
value in order for the contour strings to surround samples, but
not overlap others. To do this, select the Custom
option.
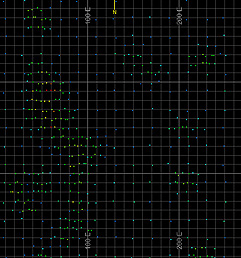
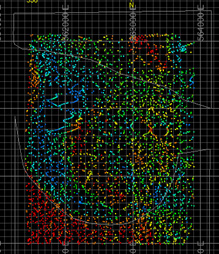
For example, the data below is 3900m from top left to bottom right corner. As a result, the output data Lowest value is automatically calculated as "0" (zero) and the Highest at "3900":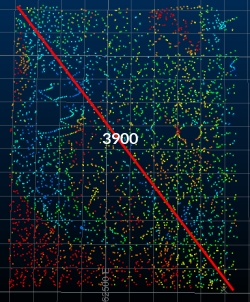
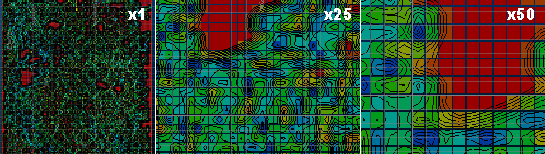
It is unlikely that you will want to record sample contours at such a big distance from each individual point - the result is likely to be an empty object as all contours will fall outside the Min and Max values calculated above. If you added, say, a very large margin, the contours would be captured, but the result would be nonsensical, e.g. a 5000m Margin results in this: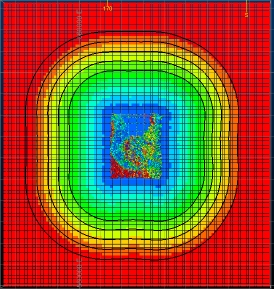
Note how the samples are congregated into a small patch in the middle of the data?
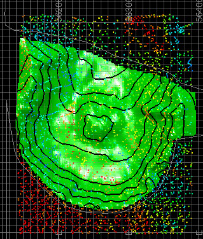
A better measure is to investigate the average inter-sample distance across an area or the whole set and to set the Highest value accordingly (zero is normally fine for the Lowest value when distance mapping). The contours and grid will then align and the output is useful (image below shows zoomed in section):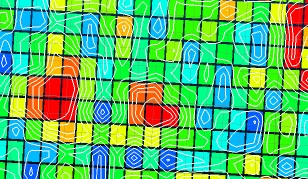
- Choose if you are going to create a new object (enter a new name and select the appropriate radio button) or use the Current strings object.
- For a distance-from-sample map, elevation data is not particularly useful, so set the Elevation value to be static for all contours.
- Enable the Output grid object. A good approach is to generate the grid model slightly below the generated contour strings so you can view them both together. For this reason, the default setting is Below data, although you can set the output grid to be created between any two elevation values if you wish.
- Enter a name for your Output grid object. A new object will be created every time for this output type. If an object of the same name exists, an index number will be added to the end (e.g. New grid2, New grid3 etc.)
- Click Finish to generate the contour strings and grid model.
- Finally, edit the block model properties for your grid object to display blocks (the default is an intersection with the current section).
- Use the View ribbon
to turn Perspective off
and set a plan view. Your model and contour strings will now be
in a useful view for interrogation, e.g.:
|
|
An online tutorial covering all of the contouring commands in Studio can be found here: https://datamine.freshdesk.com/support/solutions/articles/19000080828-contouring-tutorial (Internet connection and Datamine Support Portal login required - contact your Datamine representative if you need assistance). |

|
|
Related Topics |
|
|
generate-contours-from-points
generate-contours-from-holes-intercepts |
Copyright © Datamine Corporate Limited
JMN 20045_00_EN