|
|
Generate Contours - Output Data Configuring contouring output data |

Generate Contours - Output Data
To access this dialog:
-
From the Gridding page of the Generate Contours wizard, fill out the fields and click Next. The Gridding page is displayed.
The Output Data panel is part of the contour generation function. It is used to define the objects that will be created during contouring and their positions. It is also used to set the scope of the contour strings and the interval used for string contouring.
For more general information on contouring in Studio, see:
- Contours from Points
- Contours from Intercepts
- Procedure: Grade Contours from Points
- Procedure: Elevation Contours from Points
- Procedure: Distance-from-Sample Contours
- Example: Contours from Intercepts
- Related Topics, below
When you have completed entering details for the contour gridding,
click Finish to create the
output objects. You will need to save these to physical files (if
required) separately. All outputs are optional.
|
|
Use the Back and Next buttons to access functionality in the Generate Contours wizard. Once you have completed setting you your parameters, click Finish to create your output object(s). Once data has been generated, your previous settings can be retrieved in a subsequent session using Restore. |
Field Details:
Output Contour Strings:
This section of the dialog allows you to control the 'hull' of your output data. Once selected, you have access to the following options, all of which relate to output contour string data:
Contours: the Interval determines the proximity
of each contour to its neighbour; lower values tend to produce denser
output string data.
By default, the Interval will be used to set the elevation of each
contour string, starting from the mean of the Highest
and Lowest value in the Range (see below). You can edit
the offset to change this alignment above or below the mean elevation
value.
Alternatively, define your own custom intervals using Custom values:
- Enter a numeric value into Add value.
- Use the green arrow to transfer it to the list.
- Continue until all values (relating to the attribute initially selected on the data page) are present.
Output: you can choose to output strings data into the Current strings object, or you can select an object from the drop-down list below (and select the corresponding radio button. To create a new object, just enter a new name into the lower field and it will be created.
Range: you can choose to Use data extents,
which will be the lowest and highest value found in the Contour
attribute or
(for distance-from-sample maps) zero and the maximum linear distance
possible within the loaded data hull.
Alternatively, you can select Custom, which lets you set
the upper and lower limits on contour string generation.
Options: you can fine-tune your contour output using the following controls:
Refinement: refinement determines how much internal 'sub-sampling' occurs within your contour grid in order to achieve an accurate fit between contour strings and points. Refinement offers a processing time vs. accuracy control, with the default setting (5) offering a reasonable balance for most data inputs. A minimum setting of 3 is enforced (lower values will produce nonsensical results).
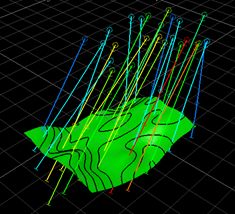
Consider the intput
data below, representing the topography of a pit phase (coloured with
RGB values):
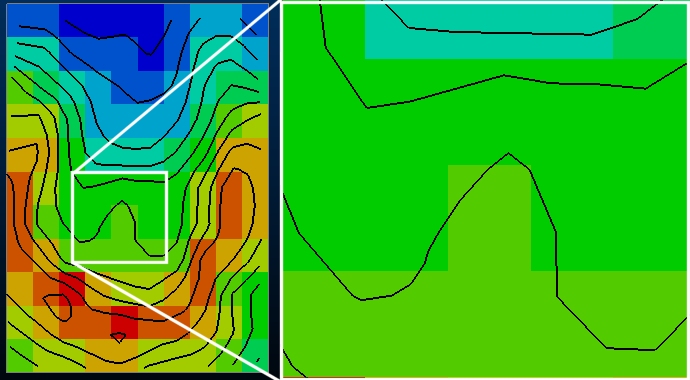
Using a sparse 10 x 10 grid is estimated using the Minimum Curvature option. The lowest
Refinement value (3) is set. The image on the left shows the output
grid and contour strings, with a magnified section on the right:
The
output grid doesn't indicate the level of sub-sampling/sub-celling
that is used to calculate the contour strings, so comparing the above
output with that from a higher refinement value (10), shown in red,
you can see how the contours differ: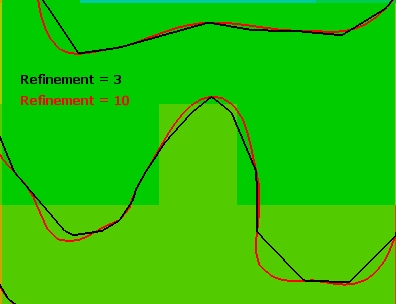
It's clearer when you show the vertices of each of the strings. Note
how the red (more refined) strings contain more vertices. This is
a result of fine sub-celling of the grid in order to fit a tighter
grid of points to the correct elevation value: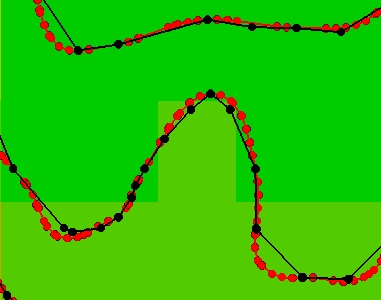
|
|
Increasing the Refinement setting leads to lengthier processing times which could significantly impact contouring projects involving particularly dense/large point data. |
Faulted Refinement: only available if a fault object was selected
on the Data page of the Generate Contours wizard, this is
similar to the above contour strings refinement. Use this setting
to specify a level of granularity/sub-celling that will be applied
when determining how fault strings are applied to the contouring process.
|
|
There are two Faulted Refinement settings on the Output Data panel. This one adjusts the resolution of the temporary grid (which is based on the current grid Resolution with additional sub-celling) in order to refine the position of the contour strings around the fault strings. The other, in the Output grid object group, is used to actually sub-cell the output block grid to incorporate the fault string data, and is explained in more detail below. |
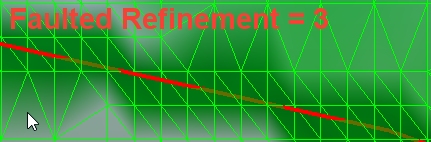
Consider the image below, where a pit phase point data object and fault
strings (shown in green) are displayed: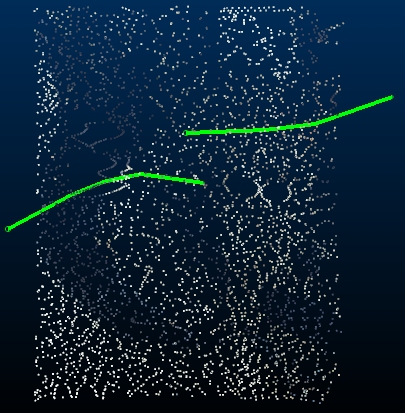
Using the lowest Faulted Refinement
setting (3), the output grid model and strings are generated in a
relatively coarse way. The image below shows the combined data set
on the left and a magnified section of the faulted area on the right: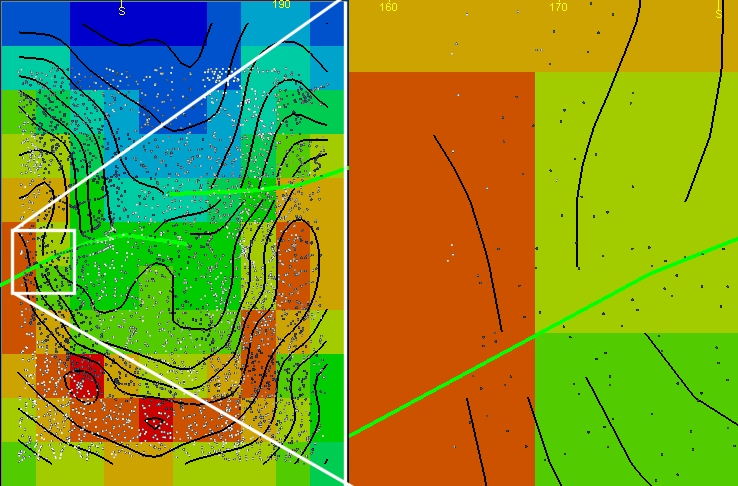
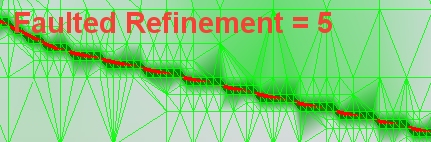
Increasing
the Faulted Refinement setting
to 10 allows the contours leading up to the fault to be more detailed
and adhere more closely to the expected elevation values. The image
below shows fault settings of 3 (red) and 10 (black) with exaggerated
string vertices: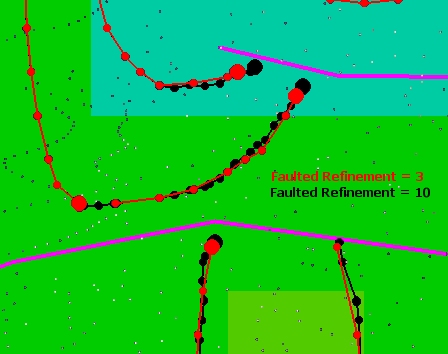
|
|
Increasing the FaultedRefinement setting leads to lengthier processing times which could significantly impact contouring projects involving particularly dense/large point data. |
Contour up to faults: by default,
contour strings do not abut a loaded fault string. Selecting this
option forces the contour to continue up to an intersection with the
fault string. The image below shows contouring outputs from 2 setups
identical in all respects other than the left image does not contour
up to the fault lines and the right image does: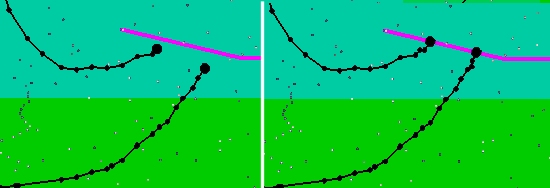
Elevation:
Use attribute: use the Contour attribute selected on the first page of the wizard to determine the elevation values of output contour strings.
Below data: produce contour strings just below the input data, as a flat "map".
Custom: set the elevation at which all contour strings will be generated (also as a flat map).
For all commands, you can set a static elevation (a 'flat map') by entering a value into the editable field below and selecting the corresponding radio button. This is the only option available for the generate-distance-contours command, otherwise, it will be the default selection if anything other than "_Z_Coord" is the Contour attribute. This will ensure all contour strings and output grid model are created at a fixed elevation. This can be useful for distance-from-sample maps and grade contouring, for example.
Output Grid Object:
A grid model (block model data type) can be created as a result of contouring. This will be a model that is 1-cell deep (the number of cells in X and Y is determined on the Gridding screen).
The output model cells represent interpolated values between sample points/drillhole intercepts. The XY alignment of input sample points and the resulting cells will be absolute, although the location of the model in Z is definable.
A general procedure for generating a grid model as part of grade contouring can be seen here.
Select this option to output a grid model. If disabled, no grid model will be created.
Below Data: the default setting, this generates a contour grid slightly below the lowest elevation value of the specified points data. This makes is easier to see the points and grid overlaid if in a plan view.
Custom: only available if dip and azimuth values were both set to zero on the Input Data panel, select this option to set the minimum and maximum elevation of the grid model cells. In effect, you are setting the model cell depth for an unrotated section.
Output (New Object): a new data object will always be created if outputting a grid model. Enter a name into the editable field. If an object of the same name already exists, the new object will be appended with an incremental index number to differentiate it.
Faulted Refinement: this setting is only available if a fault strings object was specified on the Data page of the Generate Contours wizard.
by default, the output grid model will not be sub-celled, even if fault strings intercept model cells. Any setting higher than [1] here will result in the output grid model being sub-celled, permitting smaller sub-celling (and increasing cube numbers) with higher values.
For example, the image below shows 3 coarse (10x10)
grid models, with increasing Faulted
Refinement from left to right (fault strings are shown in purple):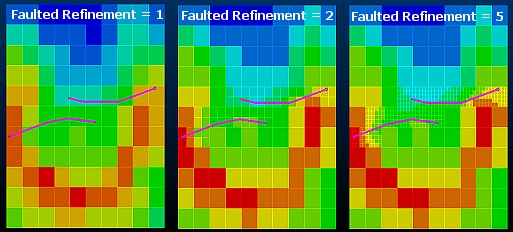
|
|
There are two Faulted Refinement settings on the Output Data panel. This one is used to sub-cell the output block grid. The other option (in the Output contour strings group) adjusts the resolution of the temporary grid (which is based on the current grid Resolution with additional sub-celling) in order to refine the position of the contour strings around the fault strings. See above for more details. |
|
|
Increasing the FaultedRefinement setting leads to lengthier processing times which could significantly impact contouring projects involving particularly dense/large point data. |
Output Surface Object (not displayed with generate-distance-contours command):
Generate a wireframe surface that correlates with your output contours. If disabled, no surface will be created.
Tolerance: enter a tolerance value to permit the surfacing/interpolation routine to relax the rules a little when projecting a surface through a sample/intercept point. This can help to remove 'dimples' in noisy data, for example.
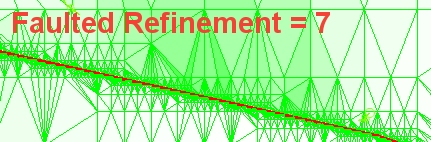
Faulted Refinement: choose how many wireframe data subdivisions are required to align data on either side of the fault with the fault string(s). This can be considered a measure of data granularity near the fault zone, with higher numbers giving rise to a closer match between the edge of the wireframe near the fault and the string itself.
In the example below the output wireframe surface has been generated for 3 refinement settings. In each case you can see how the edge is less jagged with each jump in refinement setting. Higher values will give rise to longer processing times.
Output: you can either add wireframe surface data to the Currrent wireframe object (which can be useful for building up multiple surfaces, say, reflecting each lithology within a drillhole set).
You can select any wireframe object in which to store your output surface (current or otherwise) using the drop-down list.
Alternatively, enter a new name into the editable field, and it will be created.
|
|
Contouring commands are scriptable. You can find out more using this Knowledge Base Article. |
|
|
Related Topics |
|
|
generate-contours-from-holes-intercepts
generate-contours-from-points Contours from Points - Introduction Contours from Points - Procedures |
Copyright © Datamine Corporate Limited
JMN 20045_00_EN