
Viewing Conditional Simulation Data in 3D
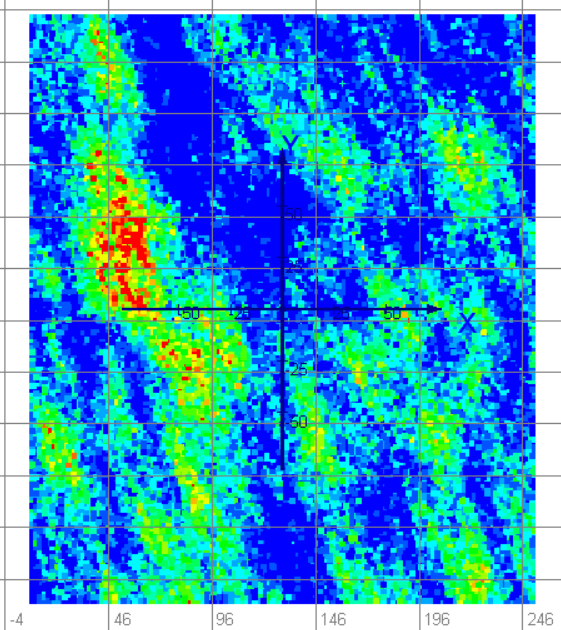
The results of the simulations produced during Simulation Generation can be viewed in the 3D Viewer by selecting the simulation in the Project Tree and opening the 3D Viewer window. Depending on the settings chosen during Simulation Generation, your simulation data may look similar to the image below.
The data view can be altered using the 3D Options Toolbar and the Colour and Size Toolbar.
Tip: If your data has white space between points, you can increase the Size on the Colour and Size toolbar. Alternatively, you can decrease the Block Size on the Conditional Simulation tab. See Configure Conditional Simulation Properties.
Each simulation can be viewed by selecting it in the Project Tree. The Etype simulation, displayed beneath all of the other simulations in the Project Tree, is the average of all conditional simulations that were generated. The Etype simulation appears much smoother than the other simulations.
Note: Make sure that you have Auto Colour activated on the Colour and Size toolbar when viewing different simulations. Without this activated, the data does not automatically change with your selection.