
Crosstab Options: General
To display this screen:
-
Display the Crosstab Options screen and select the General tab.
Select the appearance of the reported totaled fields in the Cross tab reports.
Activity steps:
-
Choose the Display Format of the Cross tab view:
-
Crosstab (Text)
Select this option to display the reported totaled fields as numeric values in a table format. By default, this field is selected.
Note: You can also click
 in the
Cross tab
Format toolbar.
in the
Cross tab
Format toolbar. -
Histogram of selected totaled fields
Select this option to display the fields that you selected in the On histogram column of the Totaled Fields tab, on a single histogram chart.
Note: After you set your options, to activate this display click in the Crosstab Format toolbar.
-
Histogram per row
Enter an Increase height factor to exaggerate the height of the histogram item for clarity. This can be useful when representing smaller numbers, or numbers in a small range.
Note: after you set your options, to activate this display click
 in the
Cross tab
Format toolbar.
in the
Cross tab
Format toolbar.
-
-
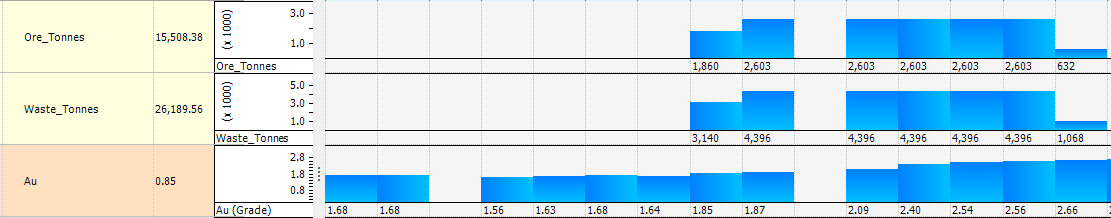
If you have selected either histogram display type want to group totaled fields when displaying data, check Group fields. Otherwise, totaled fields are reported independently. For example, in this view, Ore_Tonnes, Waste_Tonnes and AU totaled fields are not grouped (click to expand):
The same data grouped:

-
Click Fonts to display the Text Styles screen, which allows you to format the text displayed in the Crosstab report.
Related topics and activities