
Optimization Reports
Note: your application maintains a legacy Reports window, available using the Reports (Legacy) option.
Your application provides a rich reporting system so you can quickly view and analyse the results of each aspect of life of mine planning.
Reports are a breakdown of optimization calculation results by a key factor, such as mining phase and detail quantities such as product tonnes, value by destination or phase, costs, revenues and so on.
Reports are fully customisable. You can report by standard (system generated) field values or construct your own calculated fields, based on a formula.
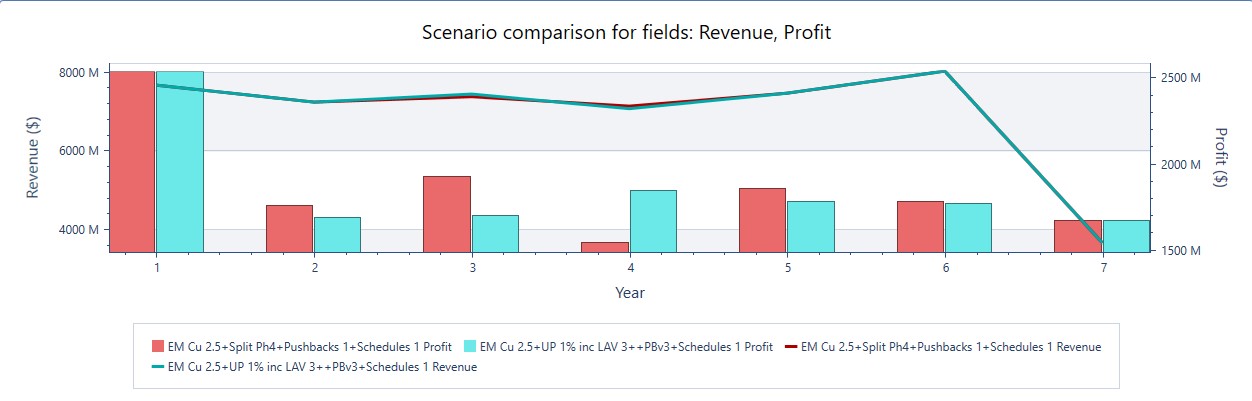
Example of a compound report comparing revenue and profit results between two scenarios
Tools are available to finalize your tabular chart including sorting and filtering options and you can export your data to external systems using transitional data formats such as comma-separated-values or directly to Excel format (.xlsx). You can also cut and paste values between systems using the clipboard.
You can also compare the results of any previously generated scenario, either by comparing tabular results or by generating a compound chart.
Reports are automatically updated as a result of subsequently running optimization workflow tasks. As such, changes to underlying data or optimization settings can be represented in charts by re-running the appropriate Optimization pane tasks.
Reports are saved to your project, and you can share report configurations using a template facility.
Sensitivity Analysis Reports
It is useful to understand how changes to schedule inputs affect the optimization workflow.
Understanding the risks and opportunities of your project is key, and by analysing your strategic plan's sensitivity to optimization parameters you can make more informed decisions about how your schedule and the intermediate data stages should be calculated.
Studio NPVS lets you set up a batch run of scenarios to compare outcomes where changes are made to key scheduling parameters including financial influences such as commodity price, mining cost, processing cost and recovery cost. Your optimization results will also be sensitive, potentially, to geophysical constraints such as slope angles and changes in stockpiled materials, for example.
Setting up a batch run is straightforward; first, define a base case with all parameter settings. Then, for each sensitivity analysis, define alternative values for one or more parameters.
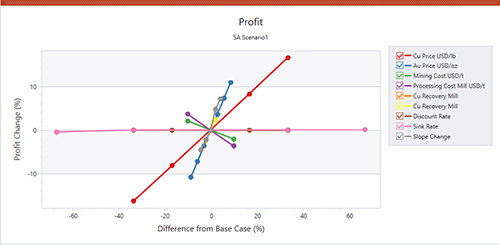
An example of a Sensitivity Analysis chart showing results for profit
For example, a base case is defined that describes the initial run's default parameters, such as product price, mining cost, sink rate, slope range and so on. In the base case, the copper price ($/lb) is 4.0. The schedule is then solved to provide the optimal extraction sequence based on this commodity price in conjunction with the other scheduling parameters (financial, physical, operational etc.). You want to see the impact on the schedule should copper fall to 3.0, so a sensitivity run is defined with only the commodity price altered.
You can then compare the tabular results via a summary report indicating comparative revenues, cost, NPV, ore and waste fractions and strip ratio for each sensitivity scenario. Results can be viewed graphically too, using the Group Chart function that presents useful spider charts highlighting the impact of setting changes on other elements of the schedule.
See Sensitivity Analysis.