|
|
Creating a Custom Display Legend Creating and applying a new display legend for a block model |

Overview
In this portion of the tutorial you are going to create and apply a custom display legend for a block model.
This legend will be used to categorize NPV sequence numbers in a set of 6 contiguous ranges.
Prerequisites
Required:
-
Created a new project and added all the required tutorial files i.e. the exercises on the Creating a New Project page.
-
Loaded and viewed the ultimate pit shell model data i.e. the exercises on the Viewing Ultimate Pit Shell Models page.
Recommended:
-
Specified project and mine design settings i.e. the exercises on the Specifying Design Settings page.
Files required for the exercises on this page:
-
_vb_npvmod1
Link to Exercises
The following exercises are available on this page:
Exercise: Creating a Custom Display Legend
In this exercise you are going to create a new interval legend named NPV SEQUENCE, for the optimal NPVS extraction field (SEQUENCE) in the block model _npvmod1. The legend will have 6 intervals, will be linear and colored using the standard rainbow color palette.
-
Activate the Format ribbon and select Overlays | Format Legends.
-
In the Legends Manager dialog, click New Legend....
-
In the Legend Wizard: Data Table Column dialog, select the Use Object Field option.
-
In the Object drop-down list, select [_vb_npvmod1 (block model)]
-
In the Field drop-down list, select [SEQUENCE], click Next.
-
In the Legend Wizard: Legend Storage dialog, select the Current Project File option, click Next.
-
In the Legend Wizard: General dialog, define the legend Name as 'NPV SEQUENCE', select the Ranges option, click Next.
-
In the Legend Wizard: Data Range dialog, define the Number of Items as '6', click Next.
")
The Minimum and Maximum values are automatically derived from the object selected on the Data Table Column dialog (step 4), and are read-only.
-
In the Legend Wizard: Legend Distribution dialog, set the Distribution Type to [Linear], select the Equal Width option, click Next.
-
In the Legend Wizard: Coloring dialog, set the Color Type Range to [Rainbow blue->red], select the Anti Clockwise transition option, click Preview Legend...
-
In the Legend dialog, check that you legend appears as shown below:
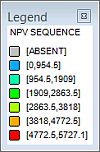
-
Close the Legend preview dialog.
-
Back in the Legend Wizard: Coloring dialog, click Finish.
-
In the Legends Manager dialog, check that the new NPV SEQUENCE legend has been added to the list of project file legends, as shown below, click Close:
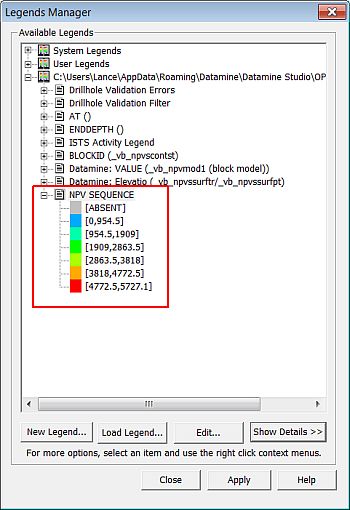
-
Click Close to dismiss the Legends Manager.
Exercise: Applying a Legend
In this exercise you are going to format the _vb_npvmod1 (block model) overlay in the Design window by coloring it using the newly created NPV SEQUENCE legend.
| This exercise follows on directly from the above exercise i.e. Creating a Custom Display Legend and assumes that it has already been completed. |
With the 3D window displayed, in the Sheets control bar, expand the Block Models folder
Double-click the [_vb_npvmod1 (block model)] to display the Block Model Properties dialog.
In the Color group, select the Legend option and the project legend [NPV SEQUENCE]. It should be at the bottom of the displayed list of available legends.
Expand the Column drop-down list and select [SEQUENCE]
Click OK and check that the 3D window block model has been colored on the SEQUENCE field values as shown below:
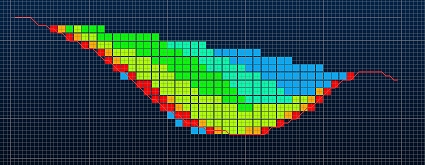
In the above image, the rainbow color sequence blue-red, applied to the SEQUENCE field values, indicates the general extraction sequence that should be followed when designing interim pits. In this view, this would be top-right down to bottom-left.
Save your project.
Exercise: Querying and Filtering Block Model Cells
In this exercise you are going to filter the _vb_npvmod1 (block model) object so that only cells with a sequence value greater than zero are displayed.
| This exercise follows on directly from the above exercise i.e. Applying a Legend and assumes that it has already been completed. |
In the 3D window, check that the view is still the north-south section as displayed in the previous exercise.
Activate the View ribbon and make sure the Clip | Width value is set to "10" (default)
Move the current section backwards 10m by clicking Sections | Forward.
Before moving, the section plane had a fixed X coordinate value of 6110. This unmoved plane lied between columns of block model cells and although the cell immediately above the view plane, i.e. towards the screen, is displayed, some queried cell values may return empty results. Moving the view plane, here 10m towards the screen, so that it intersects cells, will prevent this. After moving X=6100.
Make sure the Output window is displayed clearly (if it isn't displayed, the Home ribbon's Show menu can be used to display it).
Activate the Home ribbon and select Query | Point.
In the 3D window, click inside one of the blue cells lying outside the limits of the pit shell wireframe:
Click Done.
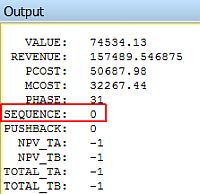
In the Output control bar note that the cells has a SEQUENCE value of '0':
Repeat steps 5 to 7 for a cell inside the pit shell and note that it has a SEQUENCE value greater than zero.
Activate the Format and select Filter | Models.
In the Expression Builder dialog, using the various controls, define and test the expression 'SEQUENCE>0', click OK.
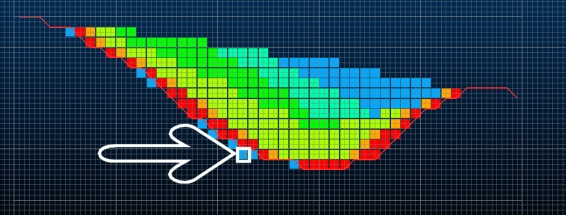
In the Design window, check that the block model has been filtered so that the blue cells (i.e. those with SEQUENCE=0) are no longer displayed, as shown below:

This filtered block model, i.e. with SEQUENCE>0 cells displayed, will be used to guide the placement of the toe strings during the open pit design process.
Save your project.
Copyright © Datamine Corporate Limited
JMN 20048_00_EN