Experimental Variograms and Variogram Fans
Variogram fans are a visual representation of the combined experimental variograms across all available directions. Creating variogram fans is often the first step in Directional Continuity Analysis and is important for determining the direction of greatest continuity in your deposit. This direction is then used during Variogram Modelling.
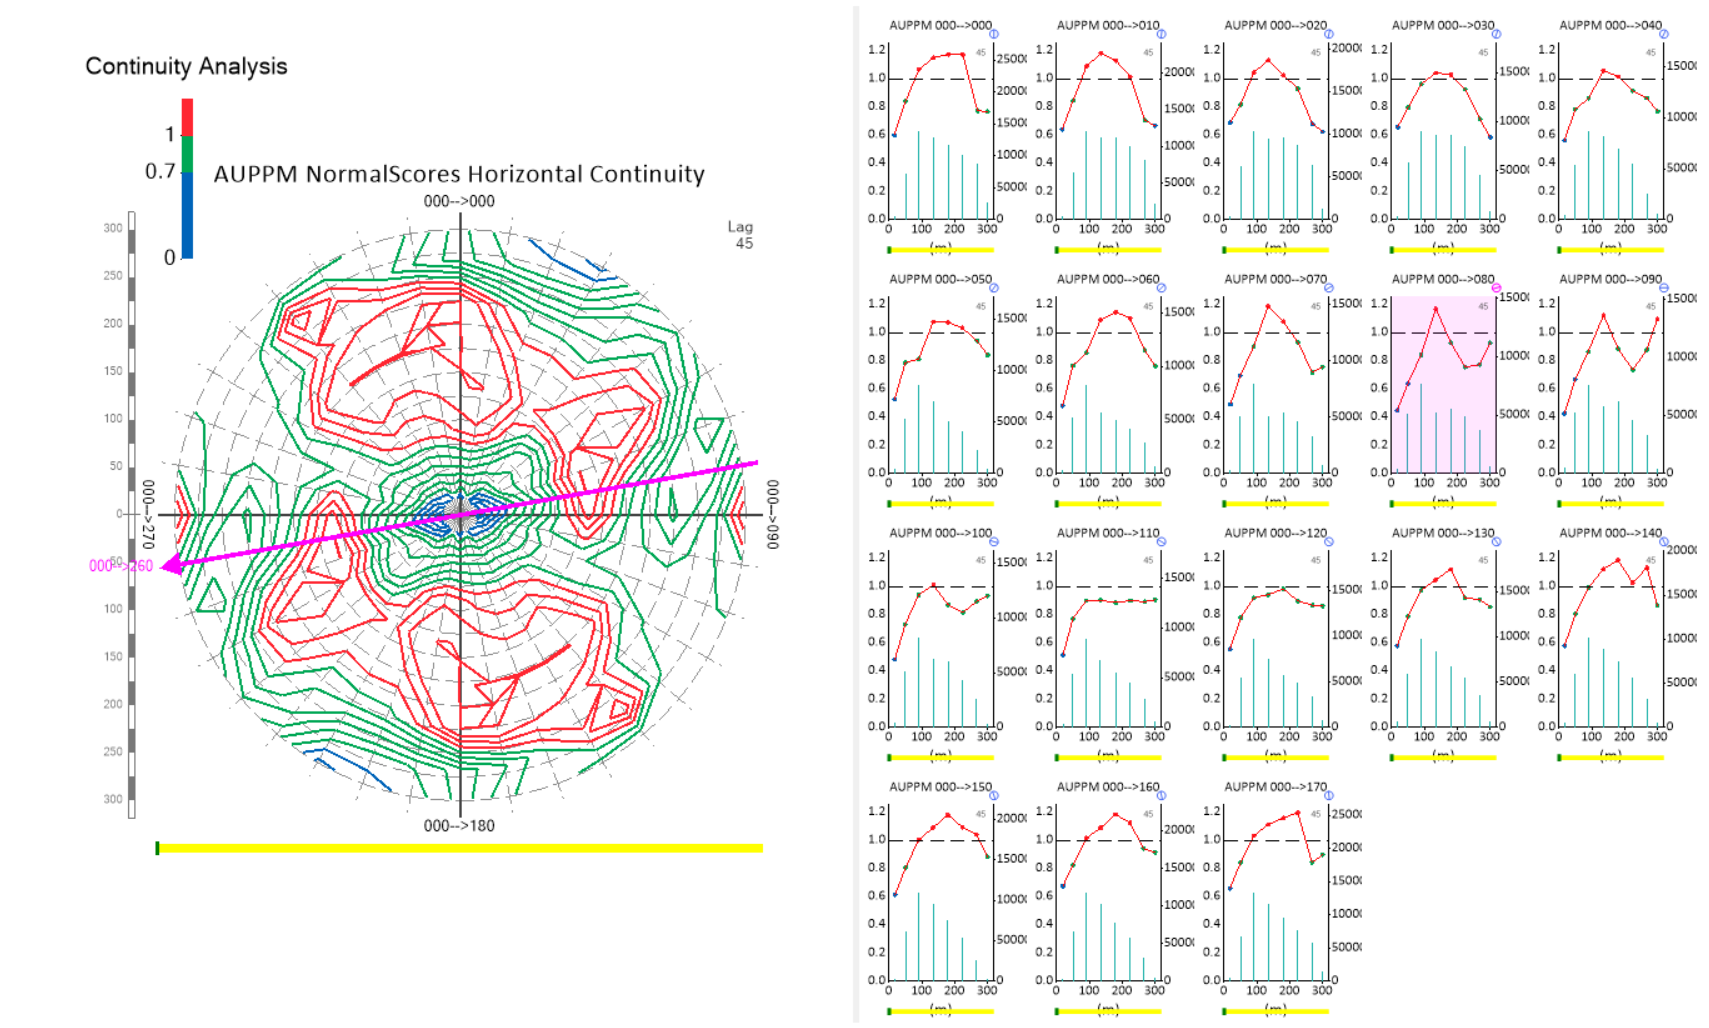
The example below shows a variogram fan (left) and all associated experimental variograms (right). Each variogram represents an angle between 000 and 170 on the variogram fan. This view is accessed by clicking any variogram fan in the Project Tree and selecting the Fan + Variograms tab.
Note: Each variogram is bi-directional. For example, an angle of 000 is equal to an angle of 180, and 90 is equal to 270 and so on.
Variogram fans in Supervisor are contoured in each orientation with available data and coloured according to how related the data is to one another. The colours in the variogram fan correspond to the colours in the individual variograms. By default, all values above the sill (1) are red and all values below the sill are green or blue. Values below the sill are split into two different colour categories to make visual interpretation easier as the variability approaches the sill.

The Fan window displays contours of standardised variance in the given plane.
The pink arrow indicates the current orientation of the protractor. Click and drag the protractor to adjust the orientation. The variogram highlighted in pink reflects the angle selected with the protractor. This orientation is used to calculate the orientation of the fan in the next plane of interest.
The yellow bar underneath the fan allows you to modify the lag distance. Click and drag the bar to the right to increase, or the left to decrease the lag distance. This change is reflected in all of the variograms next to the fan. See Select Lag Size for Variography for more details. Changing the lag distance in Supervisor does not require the continuity analysis to be recalculated.
The scale bar displayed to the left of the variogram fan shows the distance over which the fan is plotted. This distance can be changed by clicking and dragging the scale bar up and down. Labels are automatically inserted at twice the active radial spacing. This and other settings that control the display of the variogram fan can be modified in the Configure Variogram Fan Settings of the component properties window.

