Tutorial – Mapping Structures
After creating a new project, you can begin mapping structures on your 3D model. This tutorial shows you how to create each of the basic structures used in Sirovision. Work through the steps in each of the activities below to set up structures ready for analysis.
Activities
1. Add a Plane – Add at least five planes anywhere on your model. Planes allow you to map out any surface you can observe on your model. Adding multiple planes is important for the creation of analysis sets, which is described in the next part of the tutorial.
Note: If you cannot add a new structure from the Mapping Menu, ensure that your project name or Geological Model is selected in the Project Tree. The section selected in the Project Tree can impact which mapping or analysis features are currently enabled on the ribbon menu.
2. Add a User Defined Plane – User defined planes can be used in place of regular planes when you know the exact coordinates and orientation of the plane that you want to plot. This is often taken directly from field data. Add a user defined plane with the following information:
- Easting – 13600
- Northing – 4900
- Height – 692
- Dip – 60
- Dip Direction – 32
- Persistence – 50
3.Add a Trace – Add at least six traces to your model. They can be any length and orientation.
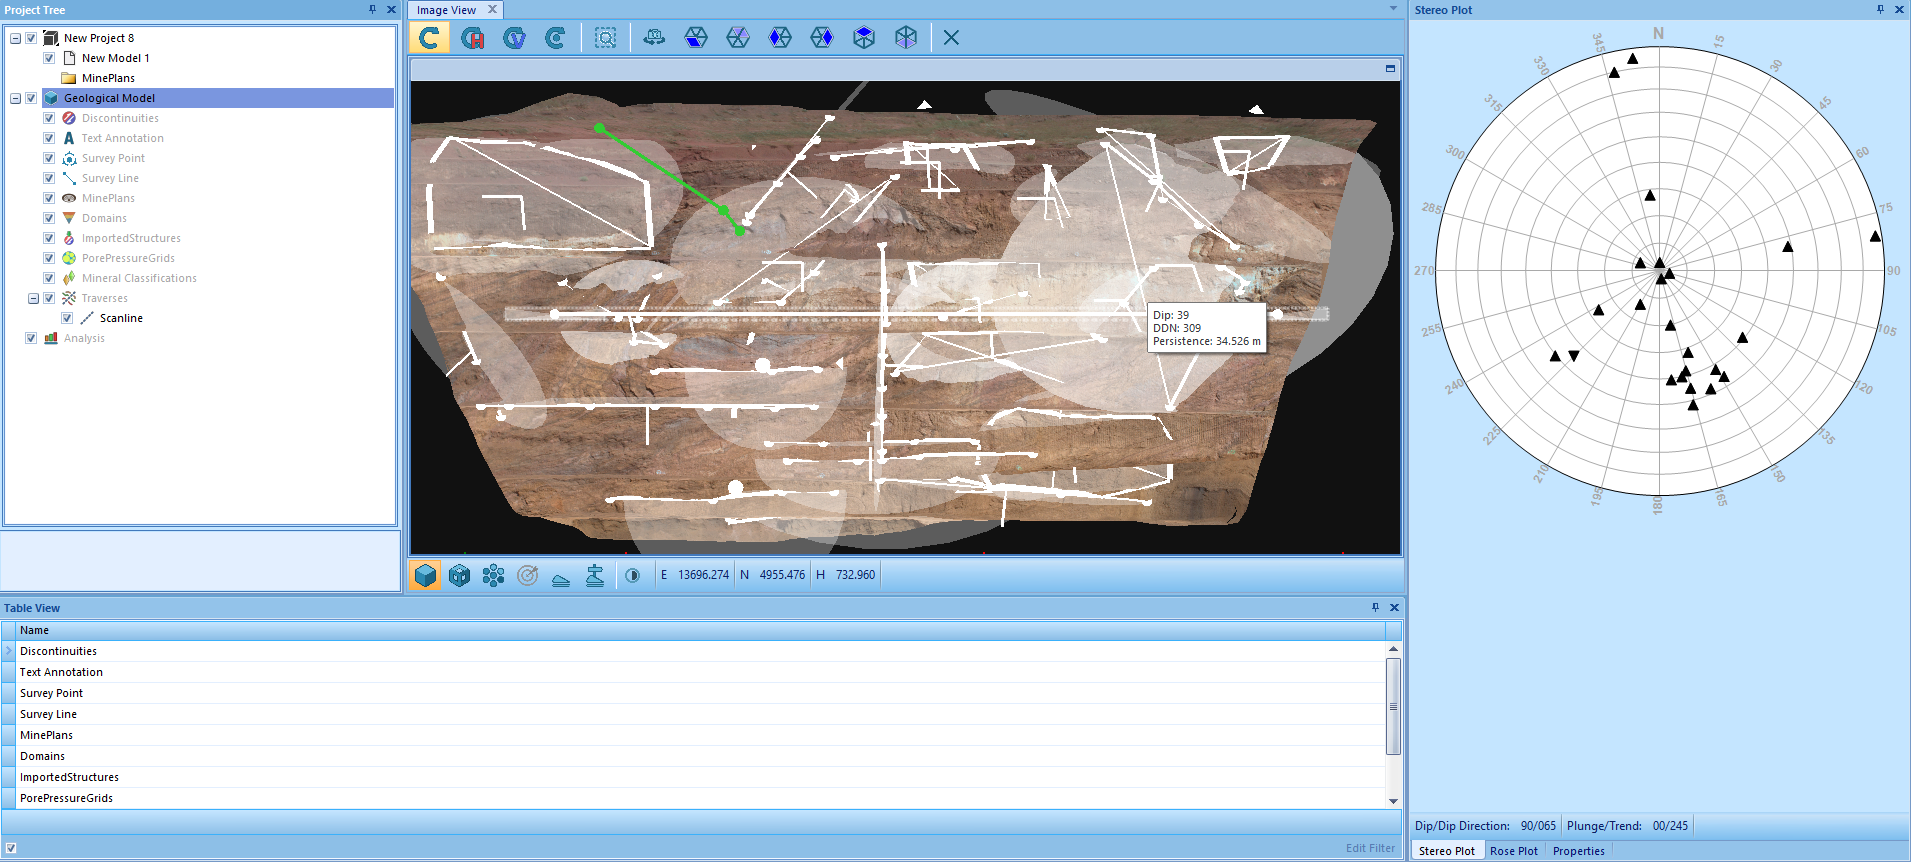
Note: Each new plane or trace that is plotted on the Image Viewer also plots a point in the Stereo Plot Tab, as well as adding a new line to the Table View Panel. Selecting a plane or trace in either of these locations highlights it on the model in the Image Viewer.
4. Bridge Two Traces – Bridge two of the traces you made in the previous step to make them into a single trace. Note how the traces become a single trace in the Table View Panel.
5. Add a Survey Point and Add a Survey Line – Survey lines are used to measure the distance between two points, whereas survey points are used to measure the exact coordinates of a location. Survey points and survey lines are not used for analysis, but can be helpful to mark and measure the features that you have mapped.
6. Add a Scanline – Draw a single scanline that crosses several of the traces that you have already drawn on your model. The scanline selects all traces that it crosses, allowing you to analyse groups of discontinuities.
Once these structures have all been added, your project should look similar to the example below. However, the exact location and number of structures will vary.


