
Display Modelling Report
Note: This topic relates to Dynamic Modelling.
To display the Volume Report window:
-
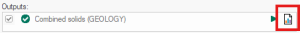
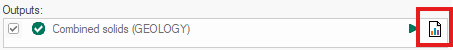
Generated a combined solids output using the Dynamic Modelling framework and click Display Report
 in the Outputs section
Once a Dynamic Modelling workflow has been processed, a report is generated automatically that assess the volume of generated domain task volumes and a combined solid (including all modelled structures).
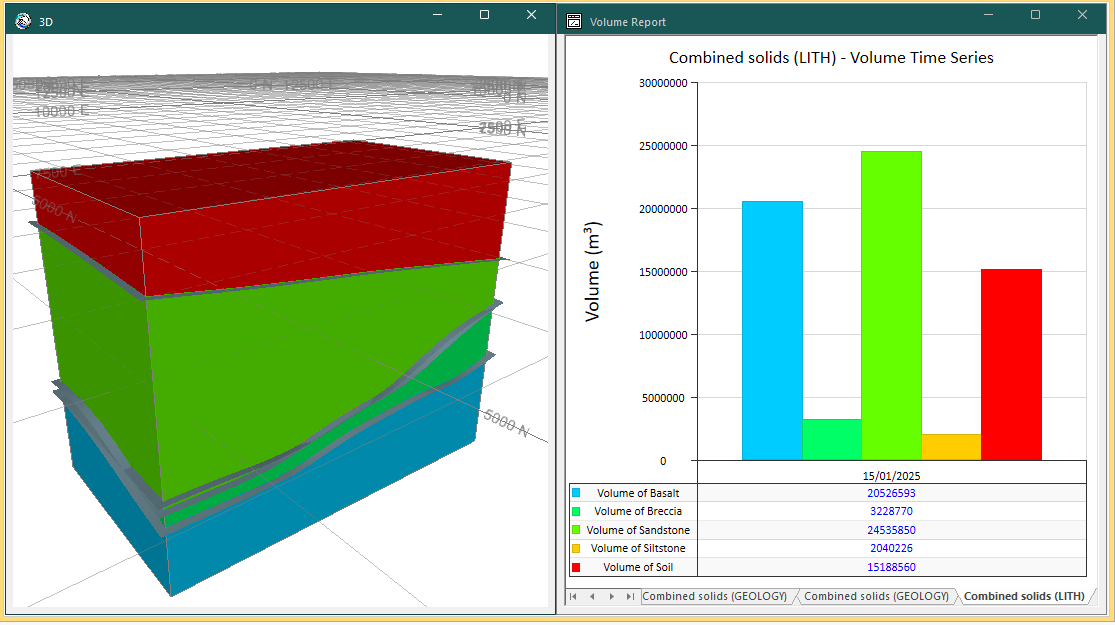
Combined solids data alongside a volume report
Each time you generate a combined solid, a record of the corresponding structure volumes is appended in your project folder (this file is called reports.xml). Where historical data exists, say from a previous run (prior to the update of drilling data), data displays showing the change in volume(s) over time.
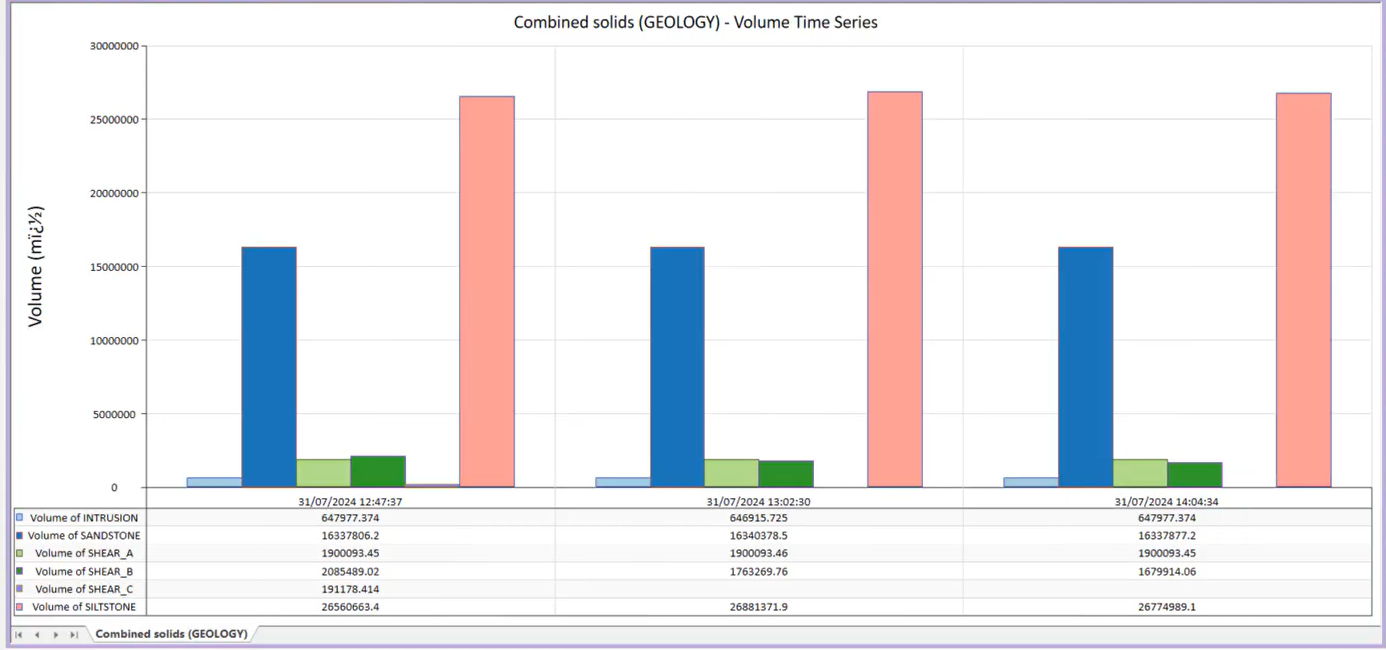
A report comparing volume changes over time
The purpose of this report is to understand the inpact to the volumes the update made. For example, as you change settings to a vein (with a Boundary Thickness of 0 on SHEAR_A), and run it again, you will see the volume will be reduced slightly for that domain. The idea is you can hide or filter the uninteresting domains (waste domains like sandstone or siltstone, for example). This lets you isolate and focus on the "ore" domains or other interesting domains.
Where multiple reports are created in the same project session, they appear as tabs along the bottom of the Volume Report window, for example:
The Report View ribbon.
Reports are displayed in a Volume Report window. Once active, a dedicated View ribbon displays, containing tools to fine-tune your chart display.
Bar and Stack Charts
-
View ribbon >> Chart Type >> Bar or Stack.
Swap between two different bar chart types. The Bar chart is a standard histogram with all data series originating at the same Y value. A stacked bar shows all data series for a date in the same bar:
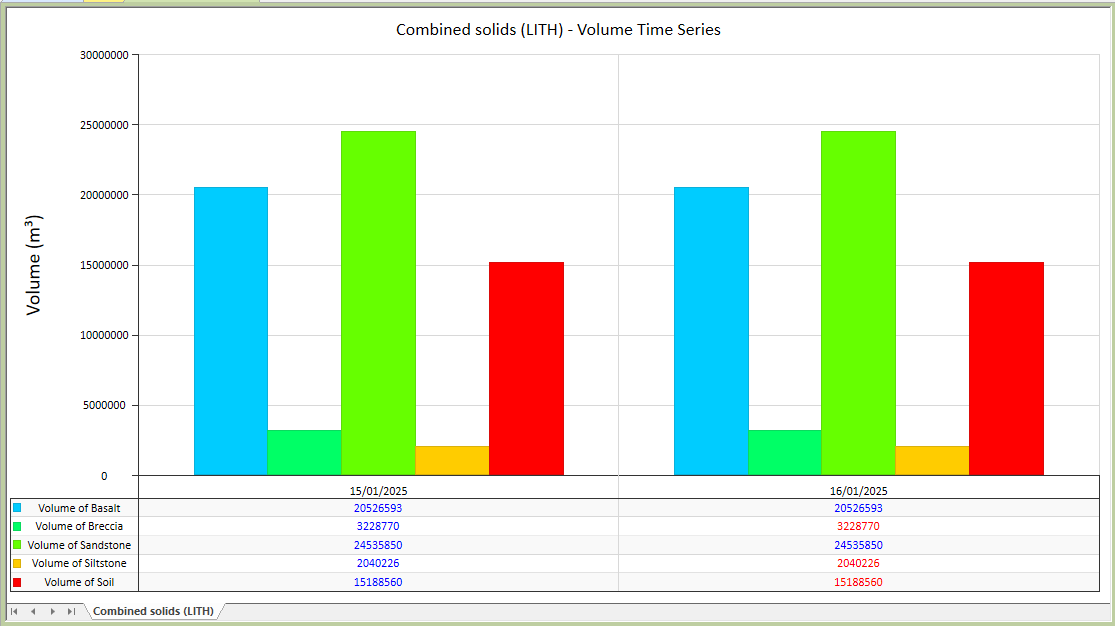
Bar Chart Example
Stacked Chart Example
Other Chart Ribbon Tools
-
Use View ribbon >> Date Range >> Previous to set the number of previous timeline items to show. For example, if your Aggregate settings (see below) are set to Daily, this value represents the number of historic dates to represent on the chart.
-
Use View ribbon >> Date Range >> Range to choose inclusive dates between which chart data displays. By default, this is from the earliest recorded chart created for the project to the date of the most recent results.
Note: Previous and Range options are mutually exclusive.
-
Use View ribbbon >> Aggregate options to change the resolution of chart timeline data. Choose from Daily, Weekly or Monthly aggregated results.
-
Use View ribbon >> Filter options to hide or show different domain value results from the volume charts. Where multiple charts are shown spanning a timeline, all charts are affected.
-
Use View ribbon >> Report to save a PNG image file of the currently displayed chart report.
Create a Report
A Volume report is calculated automatically if combined solids have been created. The output data is associated with the current date, appending the current project data file as successive reports (on future days) are created.
To display a volume report:
-
Display the Dynamic Modelling Framework framework.
-
Configure the various tasks of your workflow and ensure a Combined solids task is completed for a nominated domain value. See Define the Workflow and related topics further below.
-
Process the workflow so that volumes are generated.
-
Click View Report in the Combined Solids Outputs task, for example:
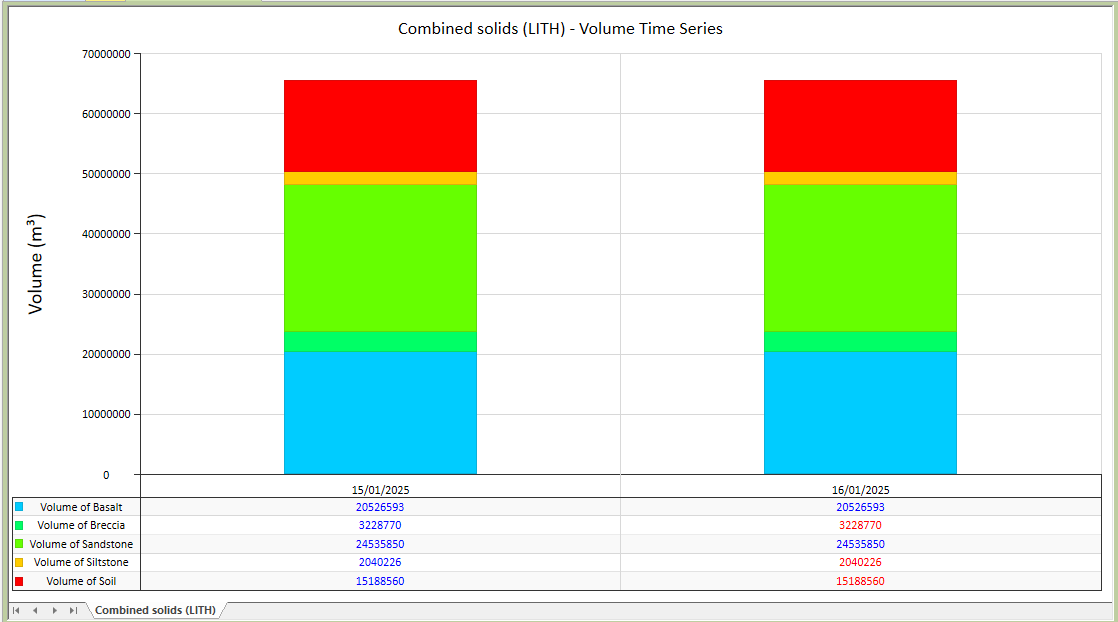
The Volume Report window displays, exhibiting a bar chart for each reporting day, for each modelled domain volume.
The volume of each structure displays in a table below the main chart.
Related topics and activities