|
|
Evaluating the Pit Design Wireframe Evaluating a pit design wireframe and grade block model |

Overview
In this portion of the tutorial you are going to evaluate a pit design wireframe using a grade block model.
Prerequisites
Required:
-
Created a new project and added all the required tutorial files i.e. the exercises on the Creating a New Project page.
-
Loaded and viewed the ultimate pit shell model data i.e. the exercises on the Viewing Ultimate Pit Shell Models page.
Recommended:
-
Specified project and mine design settings i.e. the exercises on the Specifying Design Settings page.
-
Generated a pit DTM i.e. the exercises on the Generating a Pit DTM page.
Files required for the exercises on this page:
-
_vb_pitmod1
-
_vb_npvssurfpt / _vb_npvssurftr
-
_vb_trc_pittopotr/ _vb_trc_pittopopt
Link to Exercises
The following exercises are available on this page:
Exercise: Evaluating the Pit Design Wireframe and Grade Block Model
In this exercise you are going to evaluate the pit design wireframe _vb_trc_pittopotr/ _vb_trc_pittopopt using the grade block model _vb_mod1. This includes the following tasks:
-
Defining data and view settings
-
Creating an evaluation legend
-
Applying the evaluation legend
-
Defining evaluation settings
-
Evaluating the pit
-
Saving the results to a Datamine file
-
Checking the evaluation results.
|
|
When using QUICKPIT you must always start with a closed string that represents a toe, pit base or pit top. |
Defining Data and View Settings
-
Select the Design window.
-
In the Project Files control bar, Strings folder, drag-and-drop the following file into the Design window:
-
_vb_pitmod1
-
_vb_trc_PitTopotr
-
-
In the Sheets control bar, Design Overlays folder, select only the following overlays (i.e. display these overlays):
-
Default Grid
-
_vb_npvssurftr/_vb_npvssurfpt (wireframe)
-
_vb_trc_pittopotr/ _vb_trc_pittopopt (wireframe)
-
_vb_pitmod1 (block model)
-
-
In the Loaded Data control bar, unload all other block model objects.
-
Check that _vb_pitmod1 is the current block model object i.e. highlighted bold.
-
In the Sheets control bar, Design Overlays folder, right-click _vb_trc_pittopotr/ _vb_trc_pittopopt (wireframe), select Format.
-
In the Format Display dialog, Overlays tab, Overlay Format group, Style sub-tab, Display As group, select Intersection, click Apply.
-
In the Color sub-tab, Line Style group, select the Fixed linestyle [____], and set Width to [2], click OK.
-
Repeat steps 6 to 8 for _vb_npvssurftr/_vb_npvssurfpt (wireframe), setting the color to Red (2).
-
In the View Control toolbar, click Zoom All Data.
-
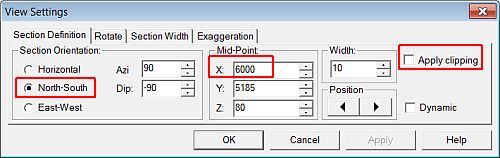
In the View Control toolbar, click View Settings.
-
In the View Settings dialog, define the Section Orientation and Mid-Point XYZ coordinate (X: 6000) parameters shown below, click OK:
-
In the View Control toolbar, click Zoom In.
-
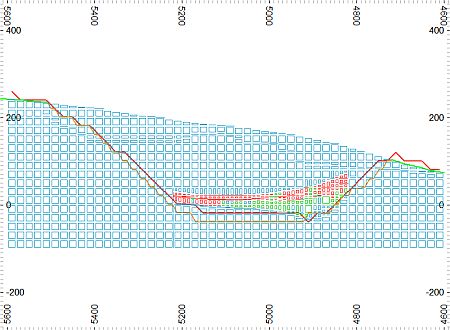
In the Design window, drag a zoom rectangle to display the view extents shown below:
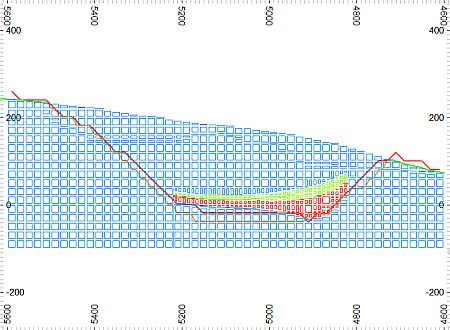
")
In the above image, the red intersection line defines the ultimate pit limits and the orange the design pit limits.
Creating an Evaluation Legend
-
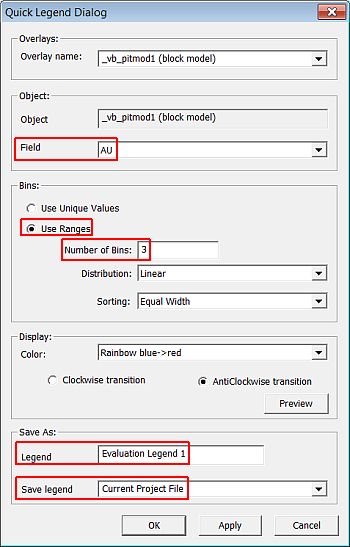
In the Sheets control bar, Design Overlays folder, right-click _vb_pitmod1 (block model), select Quick Legend.
-
In the Quick Legend dialog, define the settings shown below, click OK:
-
Select Format | Legend.
-
In the Legends Manager dialog, expand the Project Legends folder.
-
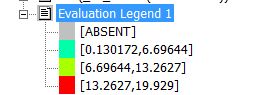
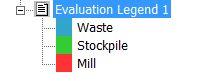
Expand the newly created Evaluation Legend 1 legend and check that it contains the legend items shown below:
-
Right-click the legend item [ABSENT], select Delete.
-
Check that you have three remaining legend items.
-
Right-click the first remaining legend item, select Edit.
-
In the Legend Item Properties dialog, Item Description group, clear Automatically generate description.
-
Type in the Description 'Waste'.
-
Select the Item Type Range, select the minimum [Absent] and define the maximum as '0.5'.
-
In the Item Format group, set the Fill Color to [(6) Cyan].
-
Select the Use fill for line color option.
-
Click OK.
-
Back in the Legends Manager dialog, select the second remaining legend item and using steps 8 to 14 above, define the following:
-
Description 'Stockpile'.
-
Select the Item Type Range, define the minimum as '0.5' and the maximum as '1.0'.
-
In the Item Format group, set the Fill Color to [(5) Green].
-
Select the Use fill for line color option.
-
-
Back in the Legends Manager dialog, select the second remaining legend item and using steps 8 to 14 above, define the following:
-
Description 'Mill'.
-
Select the Item Type Range, define the minimum as '1.0' and select the maximum [Ceiling].
-
In the Item Format group, set the Fill Color to [(2) Red].
-
Select the Use fill for line color option.
-
-
Back in the Legends Manager dialog, check that your modified legend is as shown below:
-
Click Close.
-
Select Design | Redraw.
-
In the Design window, check that the block model has been colored on AU as shown below:
Defining Evaluation Settings
-
Select File | Settings.
-
In the Project Settings dialog, select the Mine Design tab.
-
In the Evaluation Control group, define the settings shown below, click OK:
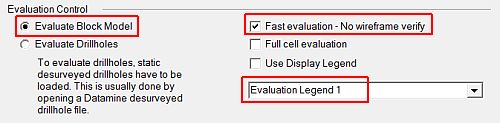
Models | Evaluate | Use Model Data (umd) could also be used to set evaluation to using block model data.
Evaluating the Pit
-
In the View Control toolbar, click View Settings.
-
In the View Settings dialog, Section Orientation group, select Horizontal, click OK.
-
Select Models | Evaluate | Wireframe (evw).
-
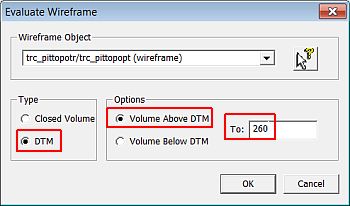
In the Evaluate Wireframe dialog, select the design pit _vb_trc_pittopotr/ _vb_trc_pittopopt (wireframe) object, define the parameters shown below, click OK:
-
In the Studio 3 Block Identifier dialog, define the Mining Block Identifier as '1', click OK.:
-
In the Accept Evaluation Results dialog, check the results, click Yes.
-
In the Loaded Data control bar, check that a new Results object is listed.
-
Repeat steps 2 to 4 for the ultimate pit _vb_npvssurftr/_vb_npvssurfpt (wireframe) object, using a Mining Block Identifier value of '2'.
Saving the Results to a Datamine File
-
In the Loaded Data control bar, right-click on the RESULTS object, select Data | Save As.
-
In the Save New 3D Object dialog, click OK.
-
In the Save New Strings dialog, select the path to you tutorial folder, define the File name: as 'Res_DesignPit1', click Save.
-
In the Loaded Data control bar, check that the RESULTS object has been replaced by the object Res_DesignPit1(table).
- Right-click , Res_DesignPit1(table),
select Data | Unload.
Unloading the results table ensures that any future evaluations are saved to a new RESULTS object.
Checking the Evaluation Results
- In the Project Files control bar, expand the All Tables or Results follder.
- Double-click Res_DesignPit1.
- In the CAE Table Editor dialog, check the string point coordinates and color values, select File | Exit.
- Back in Studio 3, select File | Save.
|
You can check your evaluation results against the example _vb_res_designpit1. |
Copyright © CAE Inc.
MIN 20048_00_EN