Insert an Indicator Variogram
Indicator variograms are used to distinguish between mixed populations and are useful for identifying different grade orientations within a structure.
Indicator variograms transform the underlying data to indicate whether vales are either above or below a certain threshold (set by you), so all values are transformed to either 0 or 1. This means that indicator variograms replace any type of data transformation in the Update tab. See Configure Variogram Update Properties.
Indicator variograms require that you set a threshold to transform your data around. Thresholds are set in Probability Plots (also called CDF plots), which are automatically inserted for each domain when data is imported. Probability plots can also be inserted at the assay level. See how to Insert a Component
Note: Inserting a probability plot at an assay level means that you are analysing data across multiple domains, rather than in a single domain where they are automatically inserted.
You must Add a Threshold under the probability plot for the indicator variogram to be inserted beneath.
Activity Steps
- Insert a probability plot beneath the domain or assay you want to analyse.
- Add a Threshold beneath the probability plot.
- Right-click the threshold in the Project Tree and select Add » Horizontal Continuity Fan from the menu.
Note: Unlike other variograms, the data cannot be transformed using the Transform field in the Update tab for indicator variograms. This is because the data has already been transformed to Indicator when the variogram fan was inserted beneath the threshold.
- Set the direction of maximum continuity by dragging the protractor (pink arrow) to the correct orientation. For more information, see Selecting the Direction of Maximum Continuity on Variogram Fans.
- Insert any remaining required variogram fans following the steps in Insert Variogram Fans.
- To insert the variogram models, right-click your final variogram fan and select Add » Continuity Models from the menu.
- Continue processing your variogram models in the same way as any other variogram. See Variogram Modelling for more information.
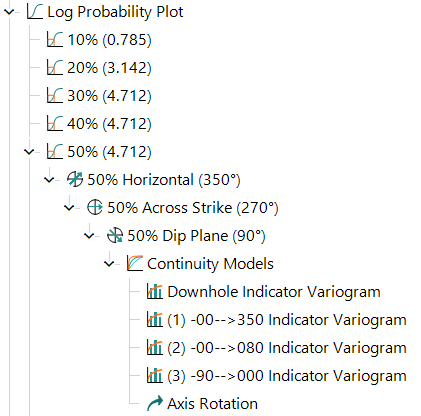
Below is an example of the Project Tree where an indicator variogram has been inserted under a 50% threshold.