
The Planning Workspace
This topics describes the screen elements you can use to support your strategic planning projects. Many of these components can be resized and repositioned. Screenshots will show a typical layout.
This topic focusses on the tools that specifically relate to the strategic planning functions in your product, including the optimal extraction sequence calculation workflow and the strategic planning database. Other, more general tools exist for displaying and formatting 3D objects, evaluating the model, editing data, wireframing and so on, and these are described in their respective context-sensitive help topics.
You can read a general topic about your application layout here.
Your application includes e a wide range user interface customization options so don't worry if screenshots in this or other topics don't match your screen exactly. Links to customization topics are provided further below.
Workspace Elements
Expand the image below for a clearer view:
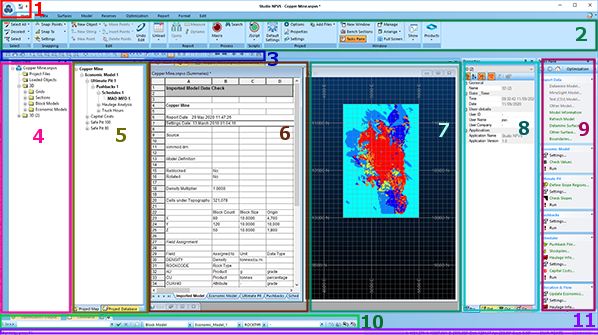
The default user interface layout in your application - you can customize this a lot
| 1 | Project and Quick Access menus |
The Project Menu contains commonly used system-level commands for saving and opening projects and more. The Quick Access Menu is a menu of commands you use often. You can customize this menu. |
|
| 2 | Ribbons | (defaults shown): categorized application commands. You can your ribbons too. | |
| 3 | Toolbars |
Toolbars can be fixed or floating, and can be docked anywhere around the edge of the screen.
|
Navigation Toolbar |
| 4 | Project Data Control Bar |
Shows loaded data and data added you have addedr for tasks such as pre-processing prior to optimization, design of slope regions and so on. This control bar is also used to format the views and control display of data in 3D and Plots windows.
|
The Project Data Bar |
| 5 | Project Map and Project Database |
The Project Map manages scenarios and shows progress through the project. Project Database: this shows the data that is managed by your application in a managed folder structure. It comprises files of formats understood by your application. Generally, the Project Database does not contain Datamine binary files (.dm, .dmx) |
|
| 6 | Summaries, Reports and Charts |
Commonly, both (6) and (7) are in the same collection of grouped tabs along with other data windows such as Start, 3D, and Plots. Summaries, reports and charts represent the results of each phase of your strategic planning project. Summaries and reports are presented in a spreadsheet-style view and chart windows support these results. |
Summaries, Reports and Charts |
| 7 | 3D View | The primary 3D view. Other 3D window tabs and external windows can exist. 3D data displays here, including schedule playback animations. | Viewing Data |
| 8 | Properties. Data Properties, Compositor and Quick Filter bars | A collection of tools used for the analysis of loaded data or project files. | Properties Control Bar
Compositor Control Bar |
| 9 | Tasks Pane | The main functional hub of your application, containing managed workflow tasks for Optimization, Reports, Visualize and Notes. | Optimization Tasks |
| 10 | Output Control Bars | Displays important information about tasks in your application, including Optimization Progress, Economic Model, Ultimate Pit, Pushbacks, Schedule and Sensitivity Analysis. | |
| 12 | Status Bar | This is updated regularly as processes and commands are run. | The Status Bar |
Related topics and activities: